
Configure Qdrant’s Optimizer for Predictable Search Latency
A bulk load finishes, and the collection looks ready: every point is in, and the upload call has returned. Then the first queries land, and search takes hundreds of milliseconds, sometimes several seconds at a stretch, while Qdrant’s indexing, merge, and vacuum optimizers work through the backlog the upload left behind. How long that lasts, and what it costs each query, depends on settings most people never touch.
Qdrant’s optimizer docs and read-write contention guide already describe that trade-off qualitatively. To put numbers on it, we built a benchmark harness:
- Data. 1.76 million Cohere-embedded MS MARCO passages.
- Hardware. A single Qdrant node running Ubuntu 26.04 x86_64, with 32GB of RAM and 14 Intel CPU cores.
- Configurations. 13 optimizer configurations, each measured both while the optimizer worked through its backlog and once it settled.
- Network. The Qdrant instance ran on the same machine as the benchmark client, which reduces network latency: reproducing this benchmark against a cloud instance would likely show higher upload and search latencies.
How We Measured It
Each run followed the same three stages, shown in the diagram as a timeline from the last point uploaded to a settled baseline:
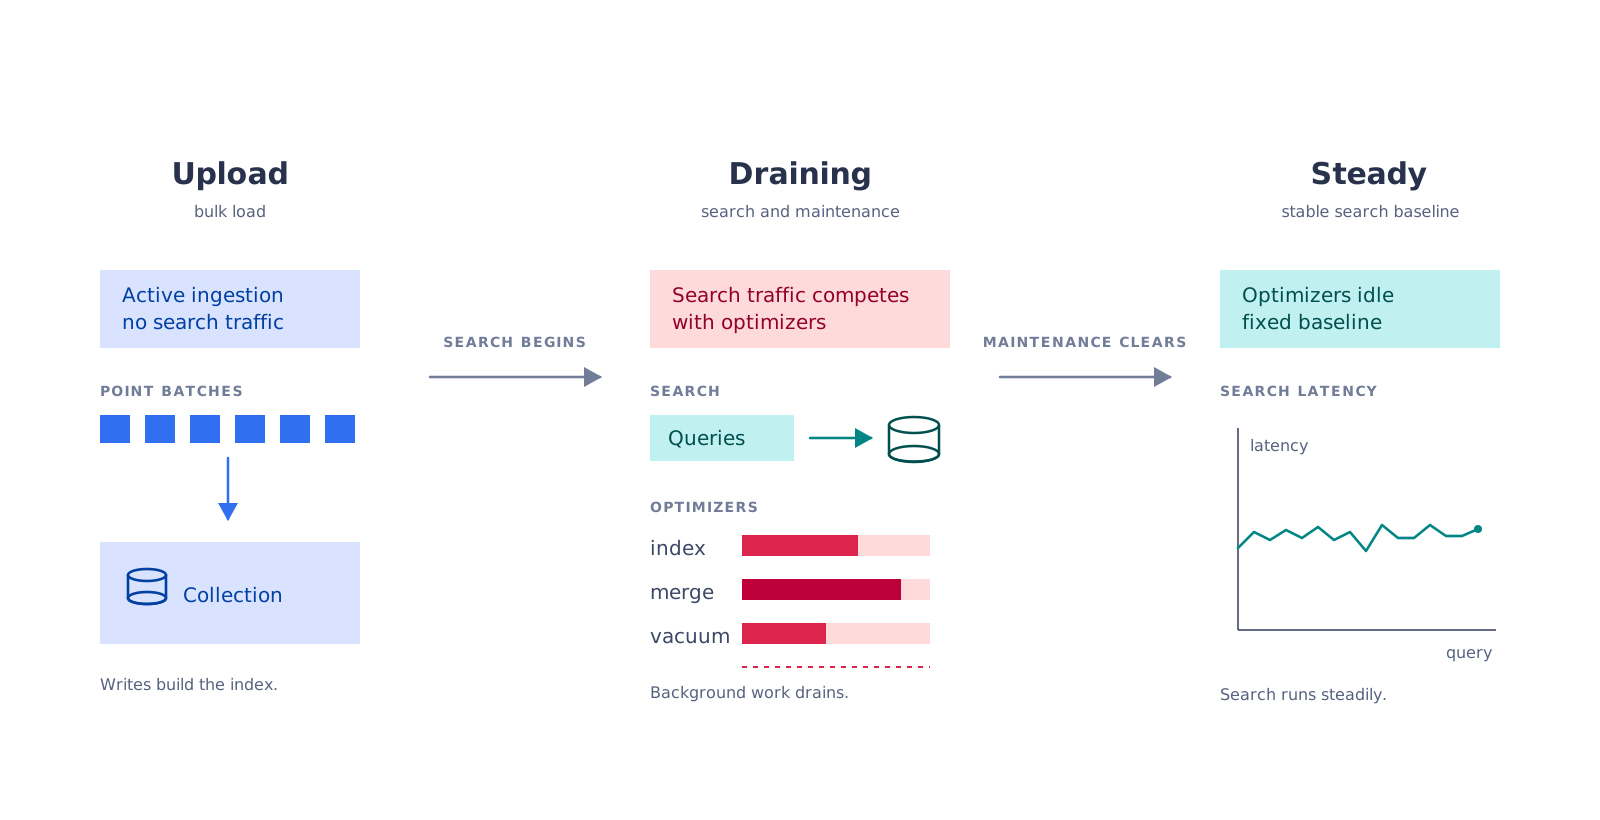
- Upload. All 1.76 million points go in with no search traffic running, so the collection is already full by the time we start measuring latency. Upload alone took anywhere from 70 to 316 seconds, depending on whether indexing was running concurrently with it.
- Draining. Once the upload finishes, we search continuously (one query in flight at a time, no batching) while polling Qdrant’s
/collections/{collection_name}/optimizationsendpoint every 2 seconds, until it reports nothing running and nothing queued. - Steady. With optimizers confirmed idle, we run five fixed passes over a separate set of 1,000 query vectors (5,000 searches) as the steady-state baseline.
That closed-loop search pattern matters for reading the sample counts in the tables that follow.
When a query takes 800 ms, only about 1.25 queries fit into a second of wall-clock time. A draining phase can run for over 10 minutes and still only collect a few hundred samples, while a steady phase with the same fixed 5,000-query workload finishes many times faster once nothing is competing with it. A small n during draining just reflects how slow search gets while optimizations are running, not missing data.
A few notes on reading the numbers below:
- All 13 collections lived on the same node for the whole test, so absolute latencies include that machine’s baseline overhead. Read them as relative effects, not as a latency SLA for your own cluster.
- The embeddings come from the
CohereLabs/msmarco-v2.1-embed-english-v3dataset on Hugging Face, one segmented parquet file of MS MARCO v2.1 passages, 1024 dimensions per vector. - Latency figures throughout are p50 (median) and p95 (95th percentile) per-query times.
Continuous Indexing Pays Off (After a Recovery Window)
We advise to leave continuous indexing on unless permanently slower search is acceptable. It costs a temporary recovery window right after ingestion, while the collection catches up on building the HNSW graph, but it results in a fully optimized index. Disabling indexing skips that window entirely, at the cost of brute-force scans for as long as indexing stays off.
We validated this by comparing continuous indexing, where the HNSW graph builds while points are ingested, against indexing disabled by raising the HNSW build threshold:
Continuous indexing needed a little over 11 minutes to clear the optimization backlog after the final point arrived. During that draining phase, search competed with optimization writes for the same resources: median latency was 780 ms, p95 reached 2.0 s, and a few queries took nearly 10 s.
Once optimizers went idle, the picture flipped:
- Median search latency dropped 180x, from 780 ms to 4.3 ms.
- p95 dropped 263x, from 2.0 s to 7.6 ms.
That gap is the cost of building a fully optimized HNSW graph while contending with live search, paid back in full once the graph is done.
Indexing disabled skipped the draining phase entirely, since there were no indexing optimizations to complete. But steady-state search paid for that: with Qdrant falling back to brute-force scans, median latency was 256.6 ms, about 60 times higher than the continuously indexed collection after optimization.
prevent_unoptimized Buys Speed
With continuous indexing, the experimental prevent_unoptimized flag (available since Qdrant 1.17.1) can reduce query latency under heavy write load. It works on the write path: once a growing segment’s data crosses indexing_threshold, further points written to that segment become deferred points, durably stored but held back from search until the segment finishes optimizing. Already-indexed data stays fully searchable throughout.
That’s a different mechanism from the older indexed_only search parameter, which instead skips large unindexed segments at query time and can make points blink in and out of results as a segment crosses the threshold.
In our analysis, enabling prevent_unoptimized dropped draining-phase p50 latency from 780 ms to 10.2 ms, a 76x improvement, with p95 at 81.3 ms. Optimizations also completed faster, in about 9 minutes instead of 11, because search queries no longer competed with optimization work for the same resources.
The chart shows the draining-phase latency drop in its first view and the shorter drain duration in its second.
This speed comes with a trade-off. Under heavy ingestion, freshly written points can sit as deferred for a while: durable, but invisible to search until their segment is optimized. Queries can return fewer results, or none for the most recent writes, until that backlog clears. Keep writes on wait=false while this is on. wait=true blocks until a point’s deferred status clears, which can be slow enough to time out a client and head-of-line-block other writes.
Segment Size Trades Recovery Time for Query Speed
Stick with Qdrant’s default of one segment per CPU core unless a specific latency target pushes you to an extreme. A single segment gives the fastest steady-state search but takes over an hour to reach it. Capping segment size clears the backlog in under five minutes, at the cost of slower queries once everything settles.
Fewer segments require more work from the merge optimizer, but result in a more compact HNSW index and faster searches. More segments reduce, or even remove, merge activity, but searches must traverse multiple segment-level indexes, which can increase latency.
We tested four configurations:
- A single segment.
- Qdrant’s default of one segment per CPU core.
- Four times the number of CPU cores.
- A smaller segment size of 100,000 KB (roughly 25,000 1024-dimensional full-precision vectors per segment).
Clearing the backlog. The single-segment configuration was by far the slowest, taking just over one hour, because the merge optimizer had to consolidate all data into one segment on top of the indexing work. Capping segment size removes that merge cost entirely: the 100,000 KB configuration completed in 283.9 seconds, 12.7x faster.
Search during draining. A single segment performed poorly here: every query had to hit the same not-yet-fully-optimized segment, keeping latency consistently high. Qdrant’s default fared better, since queries could increasingly land on already-optimized segments while only a shrinking share reached segments still being indexed. Adding more segments, either by raising the limit to four times the CPU count or by shrinking segment size, generally made draining latency slower and spikier than the default, trading it for a faster backlog cleanup.
Steady-state search. Here the single segment won outright, with 3.2 ms median latency versus 4.1 ms for the default, 23.9 ms at four times the CPU-core count, and 17.3 ms with 100,000 KB segments.
Smoother Queries vs Shorter Wait
Serialize optimizer threads if a smooth, predictable query latency during a bulk load matters more than how quickly the backlog clears. Leave Qdrant’s default thread allocation in place if the opposite is true. Optimizers run on the same threads as your Qdrant instance, so limiting or increasing the number of threads they can use directly controls how fast they clear your collection’s backlog and how much CPU capacity remains for search.
Setting both max_optimization_threads and max_indexing_threads to 1 in our benchmark stretched the draining window to 3,244.1 seconds, 6.8 times longer than Qdrant’s default settings. In exchange, search latency during draining was lower and more predictable: with a limited CPU budget, the optimizers competed less with search operations, and p95 latency was capped at 373.7 ms, less than half of the default configuration’s 820.4 ms. This matches the read/write contention trade-off the docs describe qualitatively.
The chart shows both effects: draining latency in its first view and drain duration in its second.
Vacuum: The Same Deletion, Two Opposite Outcomes
Set deleted_threshold higher than the default if you can afford the extra disk space: letting soft-deleted points sit longer avoids triggering vacuum during active search traffic, which costs more than the storage it saves.
Like many databases, Qdrant uses soft deletes: a DELETE request marks points as deleted, and queries skip them rather than immediately removing them from disk. This keeps delete operations fast, but leaves stale data in storage. Once the proportion of deleted points exceeds deleted_threshold, Qdrant’s vacuum optimizer physically removes them, and like indexing, this background write activity can contend with searches.
We compared a 20% threshold with a 50% threshold after deleting roughly 25% of the collection:
- At 20%, vacuuming triggered, and p95 search latency rose from 5.0 ms in steady state to 22.7 ms.
- At 50%, vacuuming did not run, and p95 latency fell from 5.4 ms to 4.3 ms, because fewer points remained searchable while soft-deleted points stayed on disk, avoiding expensive write operations.
Deferred Indexing Means Optimizing All at Once
Don’t defer indexing as a way to dodge read-write contention during upload unless you also enable prevent_unoptimized once you turn indexing back on. Flipping indexing on after the fact reopens the entire backlog at once, and without prevent_unoptimized, search competes with that backlog for as long as it takes to clear.
We evaluated this by running the benchmark with indexing disabled, then reconfiguring the collection to activate indexing by lowering the indexing threshold, and measuring query latency over 5 rounds of 1,000 queries each. We ran this with both prevent_unoptimized set to true and to false.
Without continuous indexing, collections lose the benefit of incremental index buildout during upload, so indexing takes longer and latency is higher once it resumes. From there, the two settings diverge sharply:
prevent_unoptimized: false. Optimizers never went idle, and search latency climbed to an overall median of 2.7 s, with the tail reaching 12.1 s. Search queries arrive continuously, repeatedly scanning the same growing backlog of unindexed points the optimizer hasn’t caught up on, and compete with the optimizers for the same I/O and CPU resources.prevent_unoptimized: true. Newly written points stayed deferred, durable but invisible to search, until their segment finished optimizing, so queries never scanned that backlog directly. Optimization progressed much faster, completing by the end of the first round of queries, and latency recovered fast: p95 came in at 621.7 ms, with a steady-state p95 of just 5.7 ms and median latency back down near 4.6 ms.
As noted earlier, that recovery only applies if a temporary loss of recall for the most recent writes is acceptable in exchange for better query latency.
Takeaways
- Try the experimental
prevent_unoptimizedflag before a bulk load if a short delay before new points become searchable is acceptable, and switch writes towait=falsefirst if your client defaults towait=true. Confirm current behavior against your Qdrant version first, since this flag is still experimental and could change. - Watch
deferred_pointsin the collection info whileprevent_unoptimizedis on. A nonzero count under load is normal; what matters is whether it drains. - Cap segment size for large loads if slower steady-state queries are an acceptable trade.
- Do not assume serializing optimizer work is free.
- Check
deleted_thresholdagainst your actual delete pattern, not just the default. - Budget for a real recovery window after a bulk load, not just the load itself.
- Don’t assume flipping indexing on later is gentler than running it from the start.
Caveats
All 13 configurations ran against the same single-node Qdrant instance, one after another, so absolute latency numbers reflect that specific machine and shouldn’t be read as general performance figures. The closed-loop search pattern also biases our draining-phase samples toward whatever finished fastest: a phase with severe contention produces fewer, noisier samples exactly when you would want more of them.
That machine ran other work throughout, not just Qdrant, so a latency change inside a benchmark run isn’t automatically proof of an optimizer effect. Two examples:
- In the indexing-disabled run from the first section, we monitored the collection’s memory via Qdrant’s
/collections/{name}/memoryendpoint and found that search latency spiked five to six times at the median exactly when the OS reclaimed memory for other processes and Qdrant’s own vector cache dropped with it. - In the first round of queries after reconfiguring indexing on with
prevent_unoptimizeddisabled, some latency bursts had no such cache signal at all, more consistent with other processes competing for resources than with anything Qdrant was doing.
We checked the optimizer status and memory status behind every result in this article before attributing it to indexing, merge, or vacuum specifically rather than to the machine. Both patterns are a caution for self-hosters who co-locate Qdrant with other workloads on the same box.
This was a local, single-node setup. Qdrant Cloud results might differ, though the underlying trade-offs are expected to be directionally the same.
Adjacent Work
- Qdrant’s optimizer docs describe how the indexing, merge, and vacuum optimizers work and how to configure them.
- The read-write contention guide explains why search and background optimization compete for the same CPU and I/O.
- The tutorial using
prevent_unoptimizedexplains how the flag affects search latency and shows how to measure it. - The full benchmarks, including harness, scripts, and results, are available on GitHub at qdrant-labs/optimizers-in-action.
 Ready to try Qdrant?