> Explore Qdrant's agent skills catalog at https://skills.qdrant.tech/
> Search the documentation at https://skills.qdrant.tech/search?query=your+query+here
> Use this file to discover all available pages: https://qdrant.tech/llms.txt
> Editor's note: This 2024 post was edited for length and clarity. Read the [original version](https://github.com/qdrant/landing_page/blob/bb7f15b97237c97748fdbeea45499e2fcaba2377/qdrant-landing/content/articles/dimension-reduction-qsoc.md). The screenshots and profiling results preserve measurements from the 2024 project.

I'm Jishan Bhattacharya, and I worked on vector visualization during Qdrant Summer of Code 2024 with Andrey Vasnetsov. Reducing high-dimensional vectors to a two-dimensional plot could leave the Web UI waiting for calculations. My project used Rust and WebAssembly (WASM) to improve that process.

Screenshots show the interface in 2024. See the [current Web UI documentation](https://qdrant.tech/documentation/web-ui/index.md) for usage.

## Moving the Calculation to Rust

We used t-distributed stochastic neighbor embedding (t-SNE) to place similar vectors near each other in a two-dimensional plot. The work involved finding neighbors in the original space and then optimizing their positions in the plot.

I first rewrote the JavaScript implementation in Rust and added multithreading. Setting up threaded WASM with Vite took work. The Rust implementation improved on the single-threaded JavaScript version, but large datasets still caused delays.

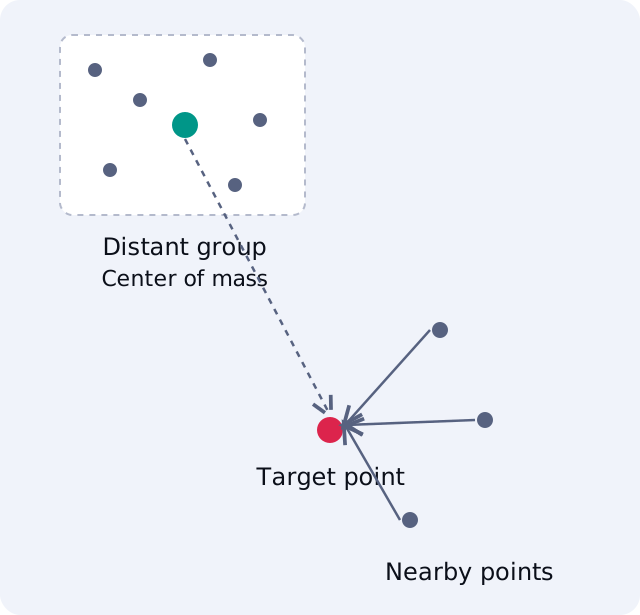
I then used a vantage-point tree for neighbor lookup and Barnes-Hut approximation for the optimization step. Barnes-Hut groups sufficiently distant points and approximates their combined effect through a cell's center of mass.

<figure><img src="/blog/dimension-reduction-qsoc/barnes-hut.svg"
    alt="A target point interacts individually with nearby points and uses one center-of-mass approximation for a distant group"><figcaption>
      <p>A distant group contributes through its center of mass, while nearby points remain separate.</p>
    </figcaption>
</figure>


## What the Project Measurements Showed

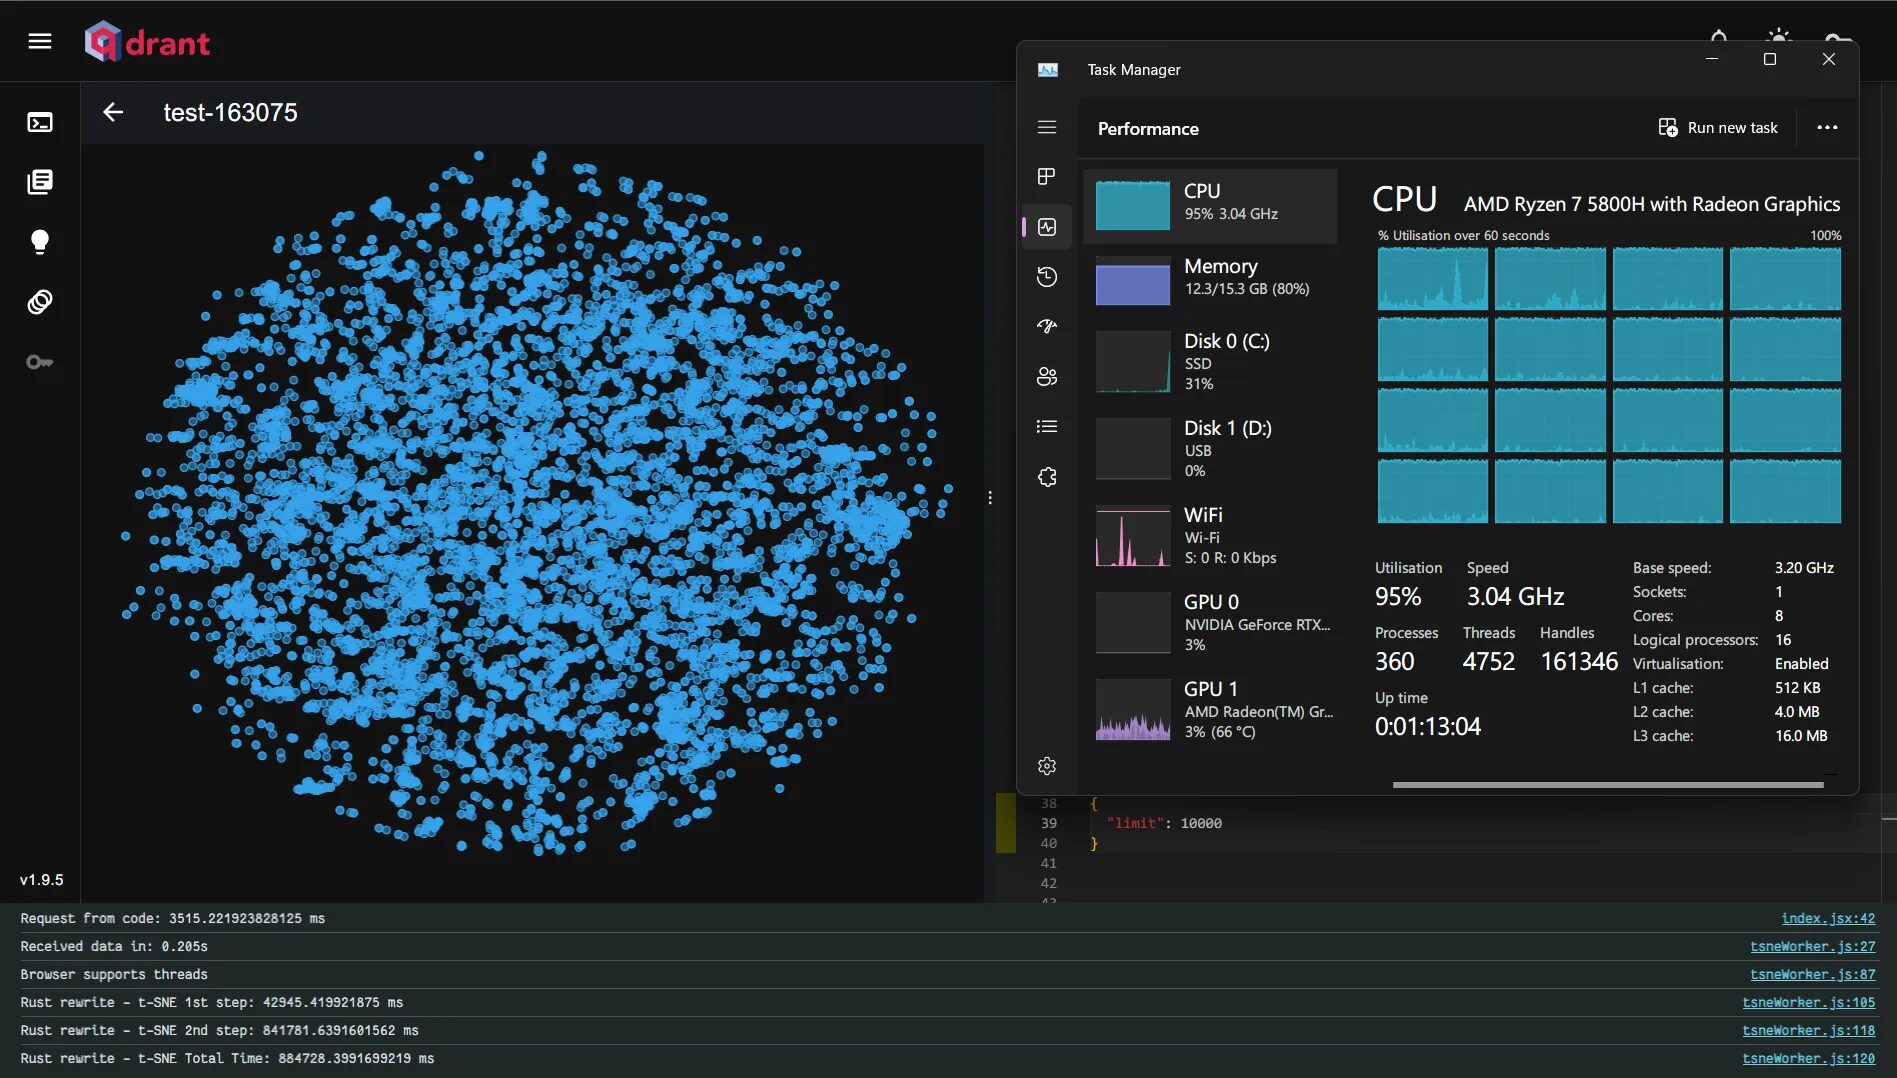
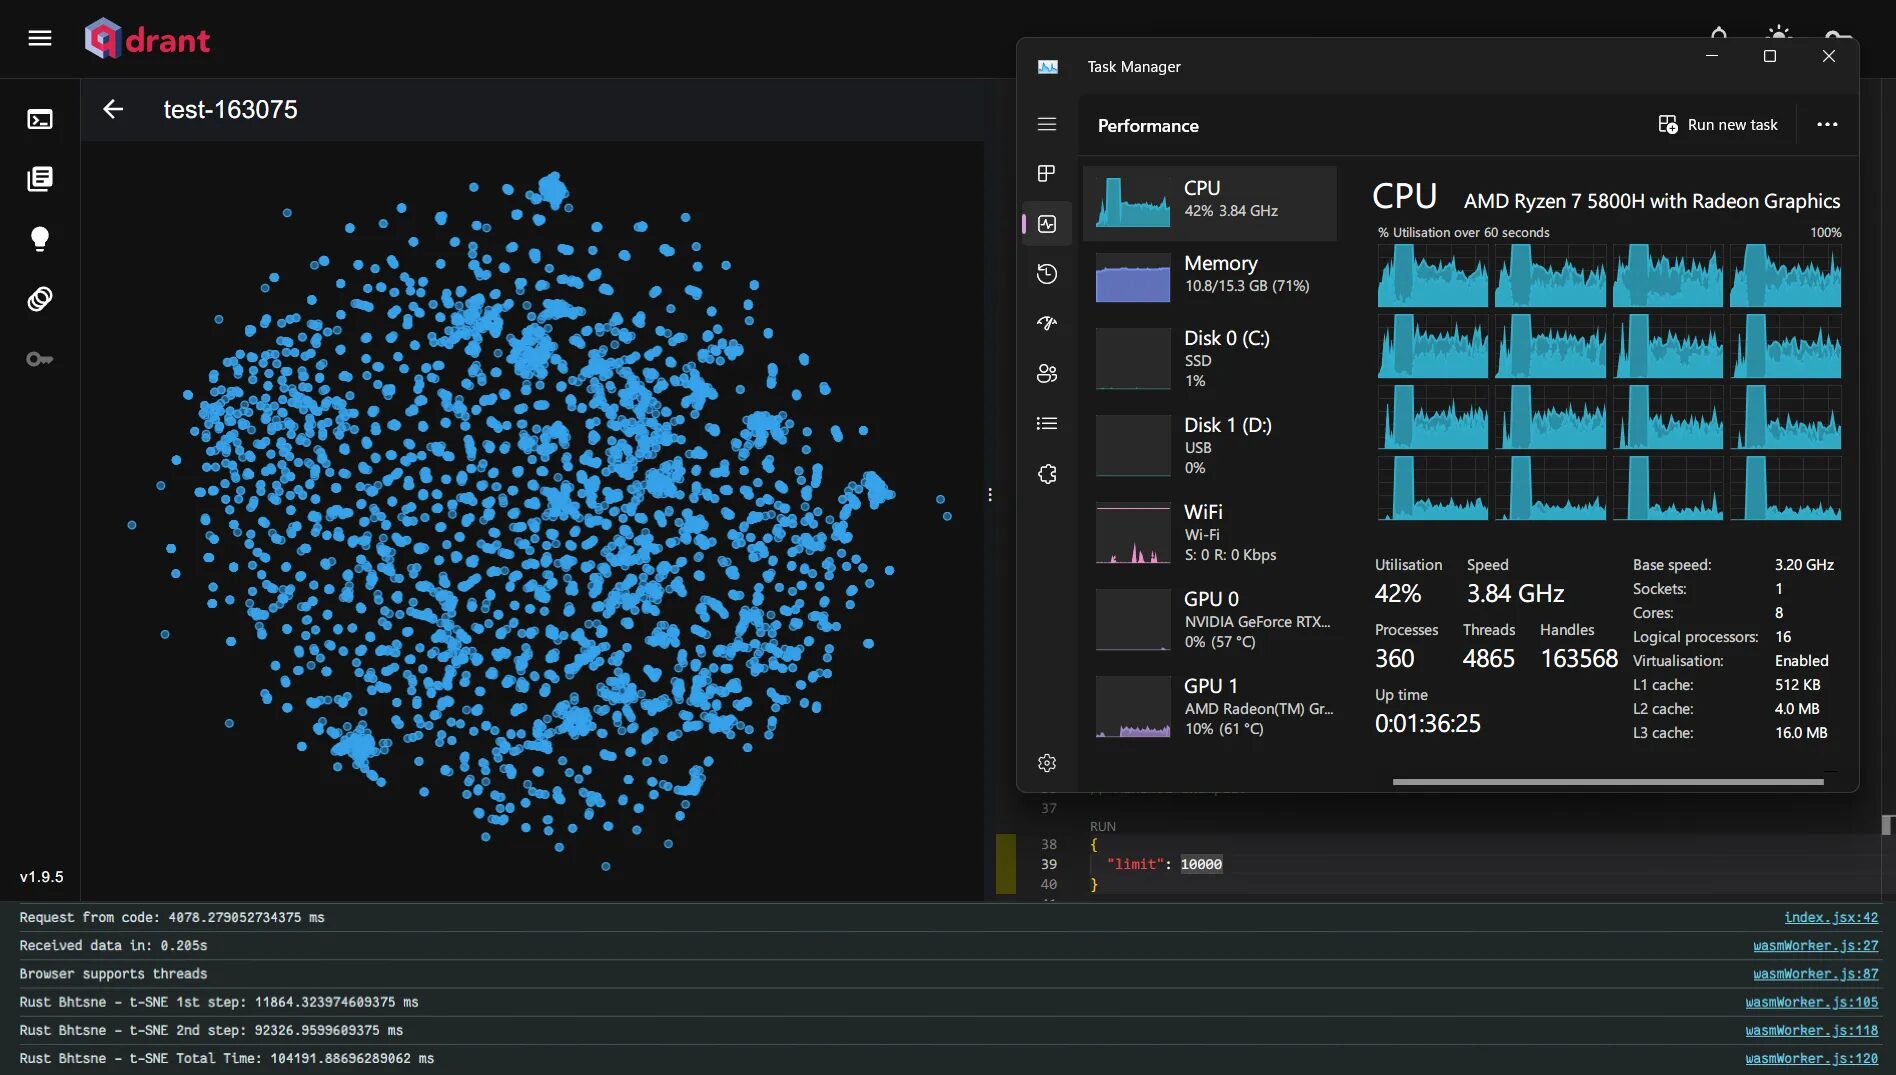
In the original comparison, both implementations processed 10,000 vectors. The exact t-SNE screenshot recorded 884.728 seconds. The Barnes-Hut screenshot recorded 104.191 seconds.

<figure><img src="/blog/dimension-reduction-qsoc/rust_rewrite.jpg"
    alt="Historical Web UI screenshot with an exact t-SNE timing of 884.728 seconds"><figcaption>
      <p>Exact t-SNE in the 2024 project: 884.728 seconds for 10,000 vectors.</p>
    </figcaption>
</figure>


<figure><img src="/blog/dimension-reduction-qsoc/rust_bhtsne.jpg"
    alt="Historical Web UI screenshot with a Barnes-Hut t-SNE timing of 104.191 seconds"><figcaption>
      <p>Barnes-Hut t-SNE in the 2024 project: 104.191 seconds for 10,000 vectors.</p>
    </figcaption>
</figure>


That was about an eightfold improvement in this comparison.

Neighbor lookup still caused delays. Approximate nearest-neighbor experiments brought little improvement, so we decided to compute neighbors on the server and pass a distance matrix to the visualization code.

## Keeping the Browser Responsive

While waiting for the distance-matrix API, I investigated communication between the worker and main threads. Serializing and deserializing intermediate results added overhead.

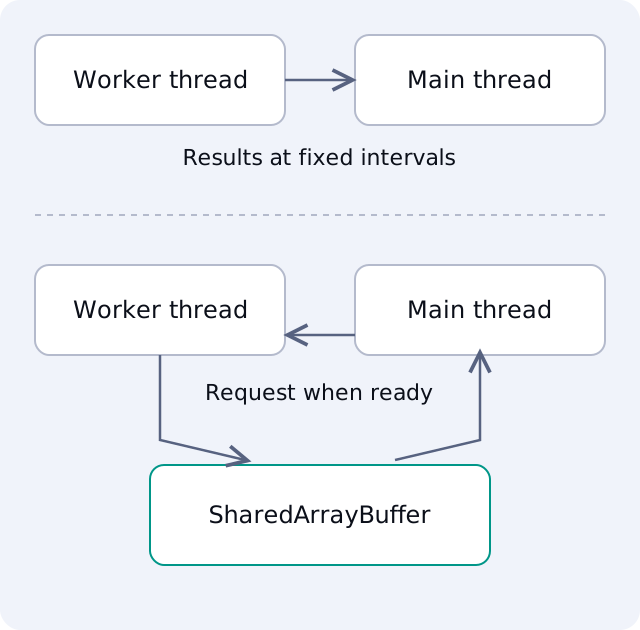
I used `SharedArrayBuffer` so the threads could access the same data. I also changed the update schedule: the main thread requested another result when it was ready to render, instead of receiving updates at fixed intervals.

<figure><img src="/blog/dimension-reduction-qsoc/rendering.svg"
    alt="Fixed-interval worker messages are compared with shared data and main-thread requests for the next result"><figcaption>
      <p>Shared data and requests from the renderer replaced repeated result transfers at fixed intervals.</p>
    </figcaption>
</figure>


I packaged the calculation interfaces in [wasm-dist-bhtsne](https://www.npmjs.com/package/wasm-dist-bhtsne), which accepts a distance matrix and returns the results.

## Remaining Work and Lessons

The project also exposed other bottlenecks. Parsing large payloads could block the main thread, and letting the worker request data directly could avoid an initial transfer.

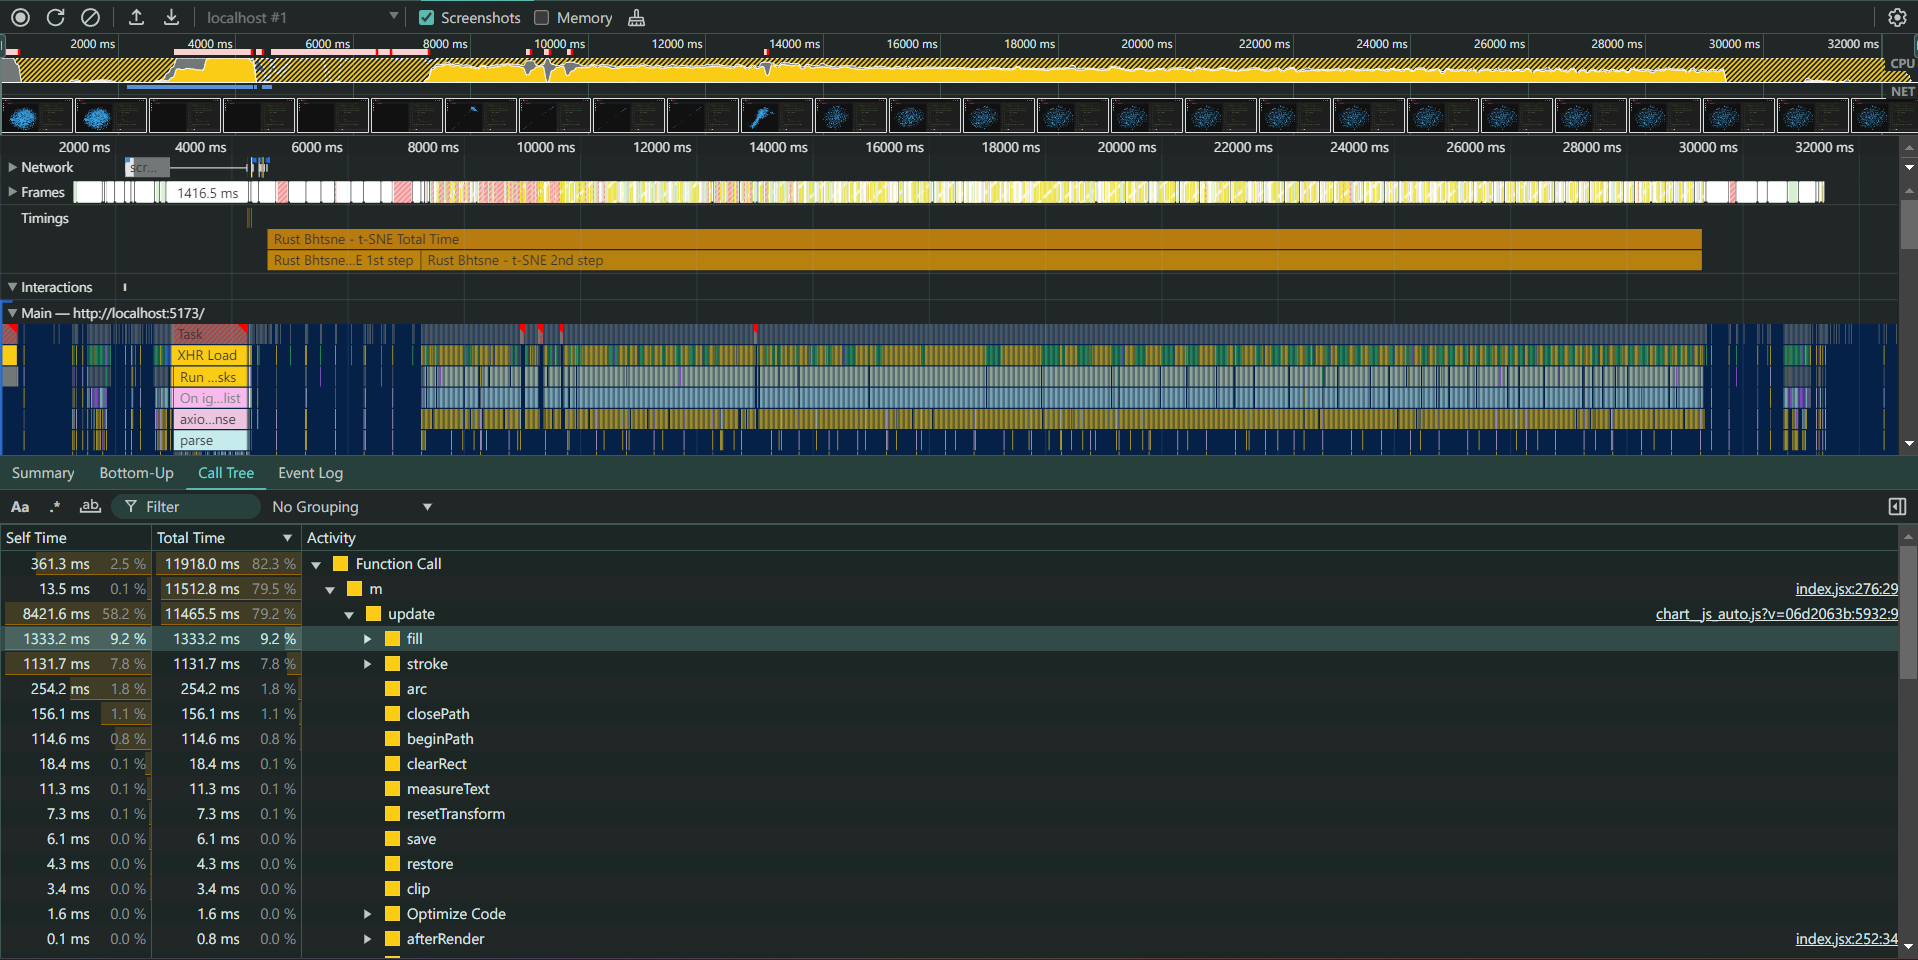
The original profiling session attributed nearly 80% of the time to the Chart.js update function. That observation suggested investigating a WebGL-based renderer.

<figure><img src="/blog/dimension-reduction-qsoc/profiling.png"
    alt="Historical browser performance profile used to investigate time spent updating Chart.js"><figcaption>
      <p>Browser profiling from the 2024 project identified rendering as another bottleneck.</p>
    </figcaption>
</figure>


The internship taught me to check the whole path from calculation to rendering. Thank you to Andrey and the Qdrant team for their help. To explore vector data today, use the [current Qdrant Web UI](https://qdrant.tech/documentation/web-ui/index.md).