- Products
- Solutions
- Developers
- Resources
- Company


QDRANT CLOUD OBSERVABILITY
See Exactly What Your Cluster Is Doing
Qdrant Cloud exposes query latency, throughput, and infrastructure metrics in OpenMetrics format. Point Prometheus, Grafana, Datadog, or another observability tool at these endpoints to track performance against your RPS targets and catch degradation early, or view baseline CPU, memory, and disk usage directly in the Qdrant Cloud Console.
WHY IT MATTERS
Ship Retrieval You Can Measure and Tune
Tune cluster performance with real-time visibility into query latency and throughput.
Tune Latency and Throughput
Tune latency and throughput together.
Watch request latency histograms and requests per second side by side, then push throughput until you find the real ceiling for your workload.

Iterate on quantization with a clear signal.
Latency and resource metrics update as you adjust quantization settings, so each experiment gives you a measurable before and after.

Compare workloads on one metrics view.
Track request volume, pending operations, and hardware usage per collection, so you can see which workload is consuming resources and allocate capacity deliberately.
WHAT YOU CAN SEE
Full Visibility Into Your Cluster

Per-collection visibility.
If your collection uses multi-vector representations for late-interaction retrieval, Point counts, vector counts, pending optimizations, and per-collection hardware metrics are labeled by collection, so a spike can be traced back to the workload causing it, including on clusters running many tenants or workloads.

Query latency and throughput signals
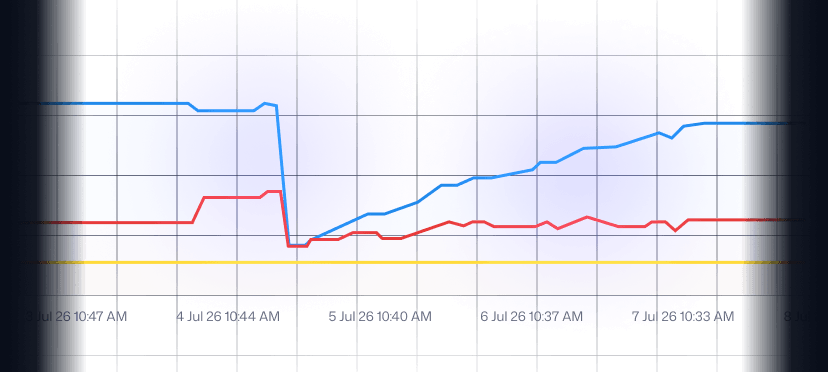
Request duration histograms, averages, min/max, and per-service load balancer timings, plus total and failed request counters for tracking RPS and error rates.

Built-in metrics in the Console
CPU, memory, and disk usage are available in the Qdrant Cloud Console.

Alerting that's already on
Qdrant Cloud monitors cluster health for you on Managed Cloud and Hybrid Cloud, memory, disk, node status, and CPU balance, and emails you automatically when something needs attention.
Observability That Fits Your Deployment
Qdrant Cloud surfaces infrastructure and request-level metrics.
Application-layer tracing, LLM call chains, and end-to-end retrieval quality scoring sit above the database layer and require a separate tool connected to your application code. If you are sizing a complex multi-tenant observability setup or need custom alerting rules validated against your specific workload, contact Qdrant to discuss your architecture.
Talk Through Your Architecture Managed Cloud
 Hybrid Cloud
 Private Cloud
 Open Source
FAQs
What metrics does Qdrant Cloud expose?
Do I have to build my own dashboards?
Can I use my existing Prometheus and Grafana setup?
Does Qdrant integrate with Datadog?
How does observability work on Hybrid Cloud versus Managed Cloud?
Can I get per-collection or per-tenant metrics?
What alerting options are available?
Does Qdrant see my vectors or collection data when it collects telemetry?
On Hybrid Cloud and Private Cloud, the isolation goes further: your database, stored data, API keys, backups, and cluster logs all stay on your own infrastructure with no Qdrant access. On Private Cloud, which is air-gapped, Qdrant sees no infrastructure metrics or metadata either.
Learn more: https://qdrant.tech/documentation/cloud-security/
