Qdrant Summer of Code 2024 - WASM based Dimension Reduction
Jishan Bhattacharya
·August 31, 2024

Introduction
Hello, everyone! I’m Jishan Bhattacharya, and I had the incredible opportunity to intern at Qdrant this summer as part of the Qdrant Summer of Code 2024. Under the mentorship of Andrey Vasnetsov, I dived into the world of performance optimization, focusing on enhancing vector visualization using WebAssembly (WASM). In this article, I’ll share the insights, challenges, and accomplishments from my journey — one filled with learning, experimentation, and plenty of coding adventures.
Project Overview
Qdrant is a robust vector database and search engine designed to store vector data and perform tasks like similarity search and clustering. One of its standout features is the ability to visualize high-dimensional vectors in a 2D space. However, the existing implementation faced performance bottlenecks, especially when scaling to large datasets. My mission was to tackle this challenge by leveraging a WASM-based solution for dimensionality reduction in the visualization process.
Learnings & Challenges
Our weapon of choice was Rust, paired with WASM, and we employed the t-SNE algorithm for dimensionality reduction. For those unfamiliar, t-SNE (t-Distributed Stochastic Neighbor Embedding) is a technique that helps visualize high-dimensional data by projecting it into two or three dimensions. It operates in two main steps:
Computing Pairwise Similarity: This step involves calculating the similarity between each pair of data points in the original high-dimensional space.
Iterative Optimization: The second step is iterative, where the embedding is refined using gradient descent. Here, the similarity matrix from the first step plays a crucial role.
At the outset, Andrey tasked me with rewriting the existing JavaScript implementation of t-SNE in Rust, introducing multi-threading along the way. Setting up WASM with Vite for multi-threaded execution was no small feat, but the effort paid off. The resulting Rust implementation outperformed the single-threaded JavaScript version, although it still struggled with large datasets.
Next came the challenge of optimizing the algorithm further. A key aspect of t-SNE’s first step is finding the nearest neighbors for each data point, which requires an efficient data structure. I opted for a Vantage Point Tree (also known as a Ball Tree) to speed up this process. As for the second step, while it is inherently sequential, there was still room for improvement. I incorporated Barnes-Hut approximation to accelerate the gradient calculation. This method approximates the forces between points in low dimensional space, making the process more efficient.
To illustrate, imagine dividing a 2D space into quadrants, each containing multiple points. Every quadrant is again subdivided into four quadrants. This is done until every point belongs to a single cell.
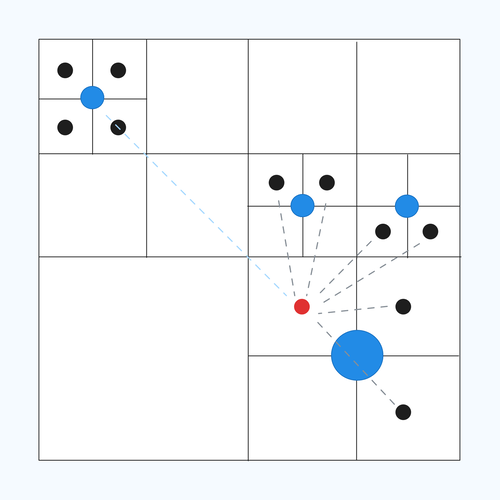
Barnes-Hut Approximation
We then calculate the center of mass for each cell represented by a blue circle as shown in the figure. Now let’s say we want to find all the forces, represented by dotted lines, on the red point. Barnes Hut’s approximation states that for points that are sufficiently distant, instead of computing the force for each individual point, we use the center of mass as a proxy, significantly reducing the computational load. This is represented by the blue dotted line in the figure.
These optimizations made a remarkable difference — Barnes-Hut t-SNE was eight times faster than the exact t-SNE for 10,000 vectors.
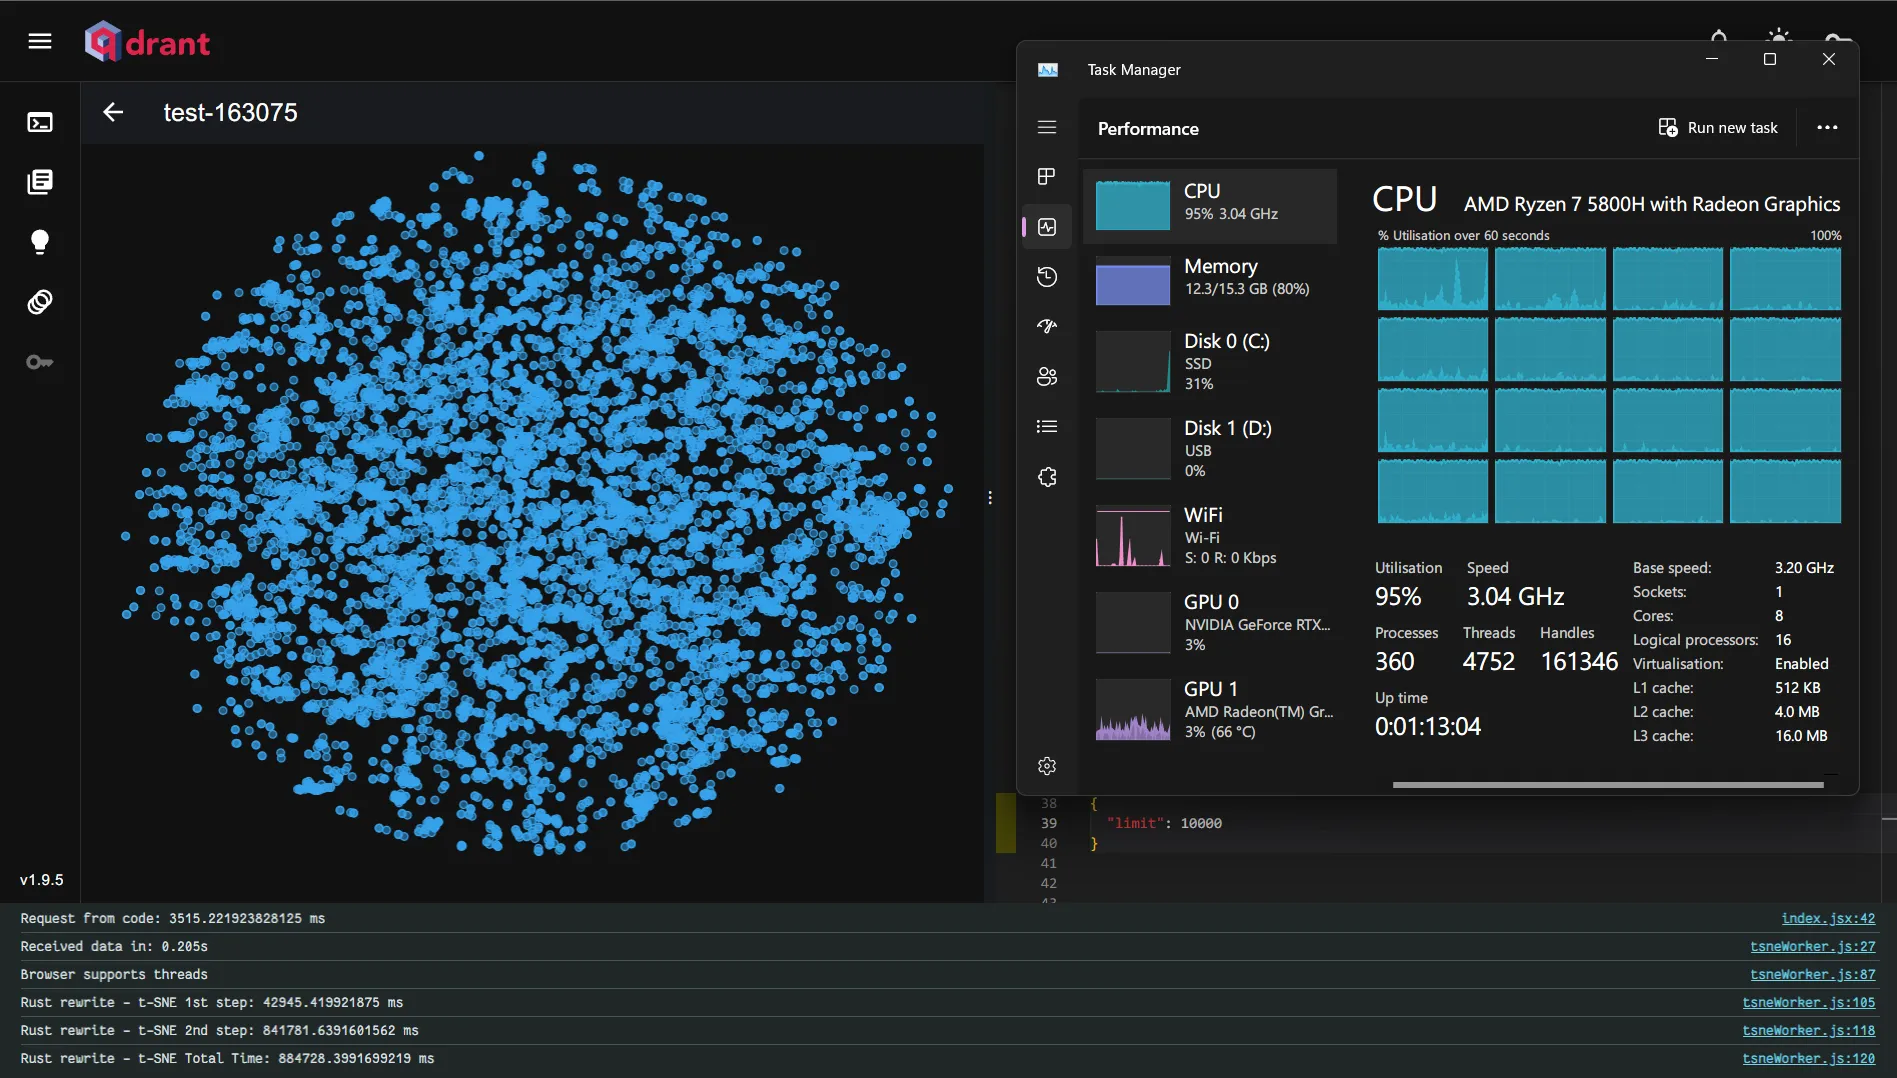
Exact t-SNE - Total time: 884.728s
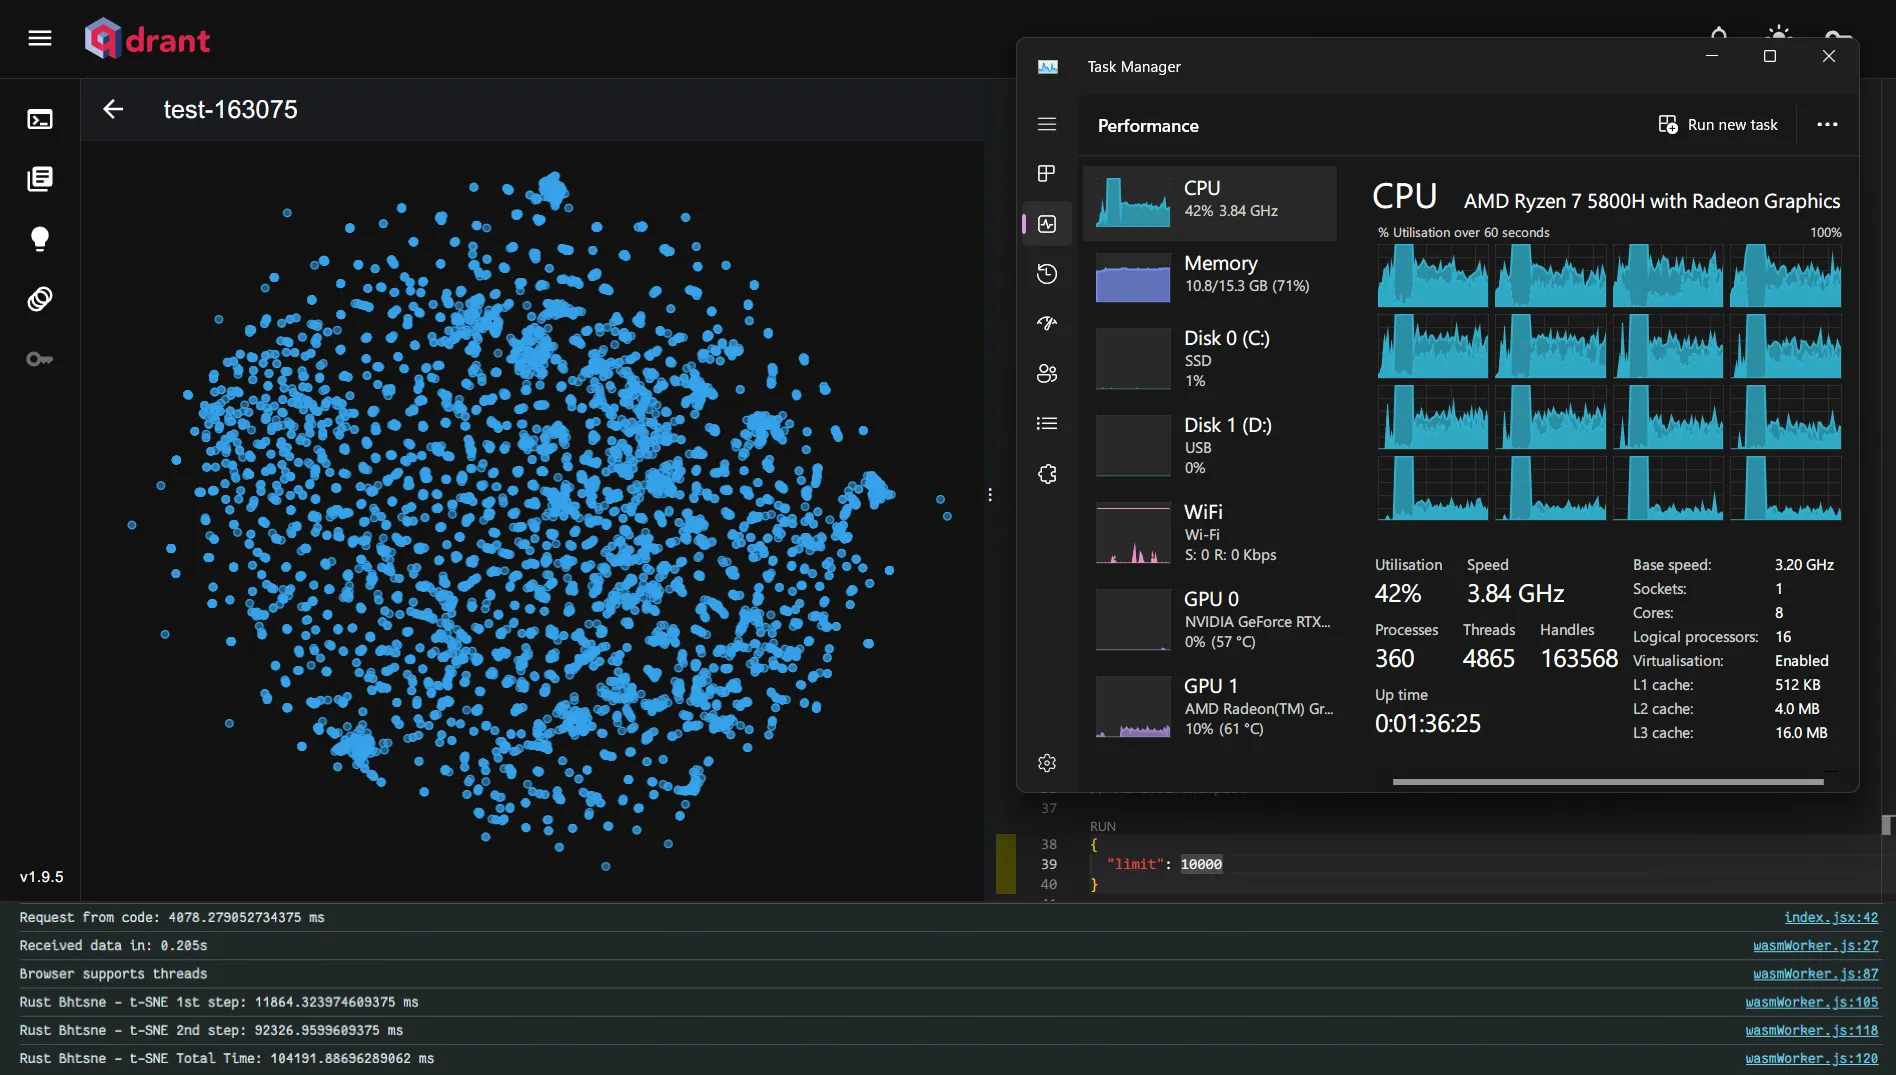
Barnes-Hut t-SNE - Total time: 104.191s
Despite these improvements, the first step of the algorithm was still a bottleneck, leading to noticeable delays and blank screens. I experimented with approximate nearest neighbor algorithms, but the performance gains were minimal. After consulting with my mentor, we decided to compute the nearest neighbors on the server side, passing the distance matrix directly to the visualization process instead of the raw vectors.
While waiting for the distance-matrix API to be ready, I explored further optimizations. I observed that the worker thread sent results to the main thread for rendering at specific intervals, causing unnecessary delays due to serialization and deserialization.
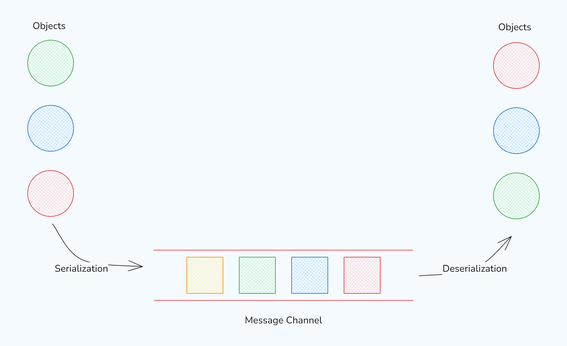
Serialization and Deserialization Overhead
To address this, I implemented a SharedArrayBuffer, allowing the main thread to access changes made by the worker thread instantly. This change led to noticeable improvements.
Additionally, the previous architecture resulted in choppy animations due to the fixed intervals at which the worker thread sent results.
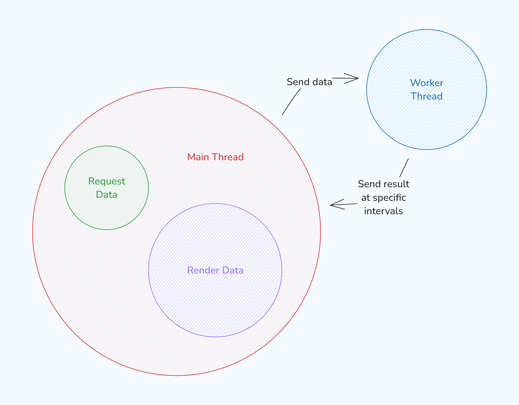
Previous architecture with fixed intervals
I introduced a “rendering-on-demand” approach, where the main thread would signal the worker thread when it was ready to render the next result. This created smoother, more responsive animations.
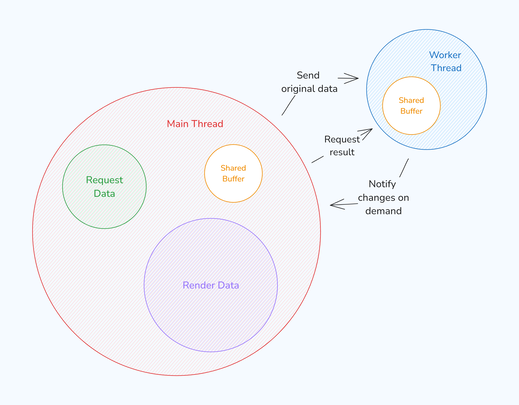
Current architecture with rendering-on-demand
With these optimizations in place, the final step was wrapping up the project by creating a Node.js package. This package exposed the necessary interfaces to accept the distance matrix, perform calculations, and return the results, making the solution easy to integrate into various projects.
Areas for Improvement
While reflecting on this transformative journey, there are still areas that offer room for improvement and future enhancements:
Payload Parsing: When requesting a large number of vectors, parsing the payload on the main thread can make the user interface unresponsive. Implementing a faster parser could mitigate this issue.
Direct Data Requests: Allowing the worker thread to request data directly could eliminate the initial transfer of data from the main thread, speeding up the overall process.
Chart Library Optimization: Profiling revealed that nearly 80% of the time was spent on the Chart.js update function. Switching to a WebGL-accelerated chart library could dramatically improve performance, especially for large datasets.
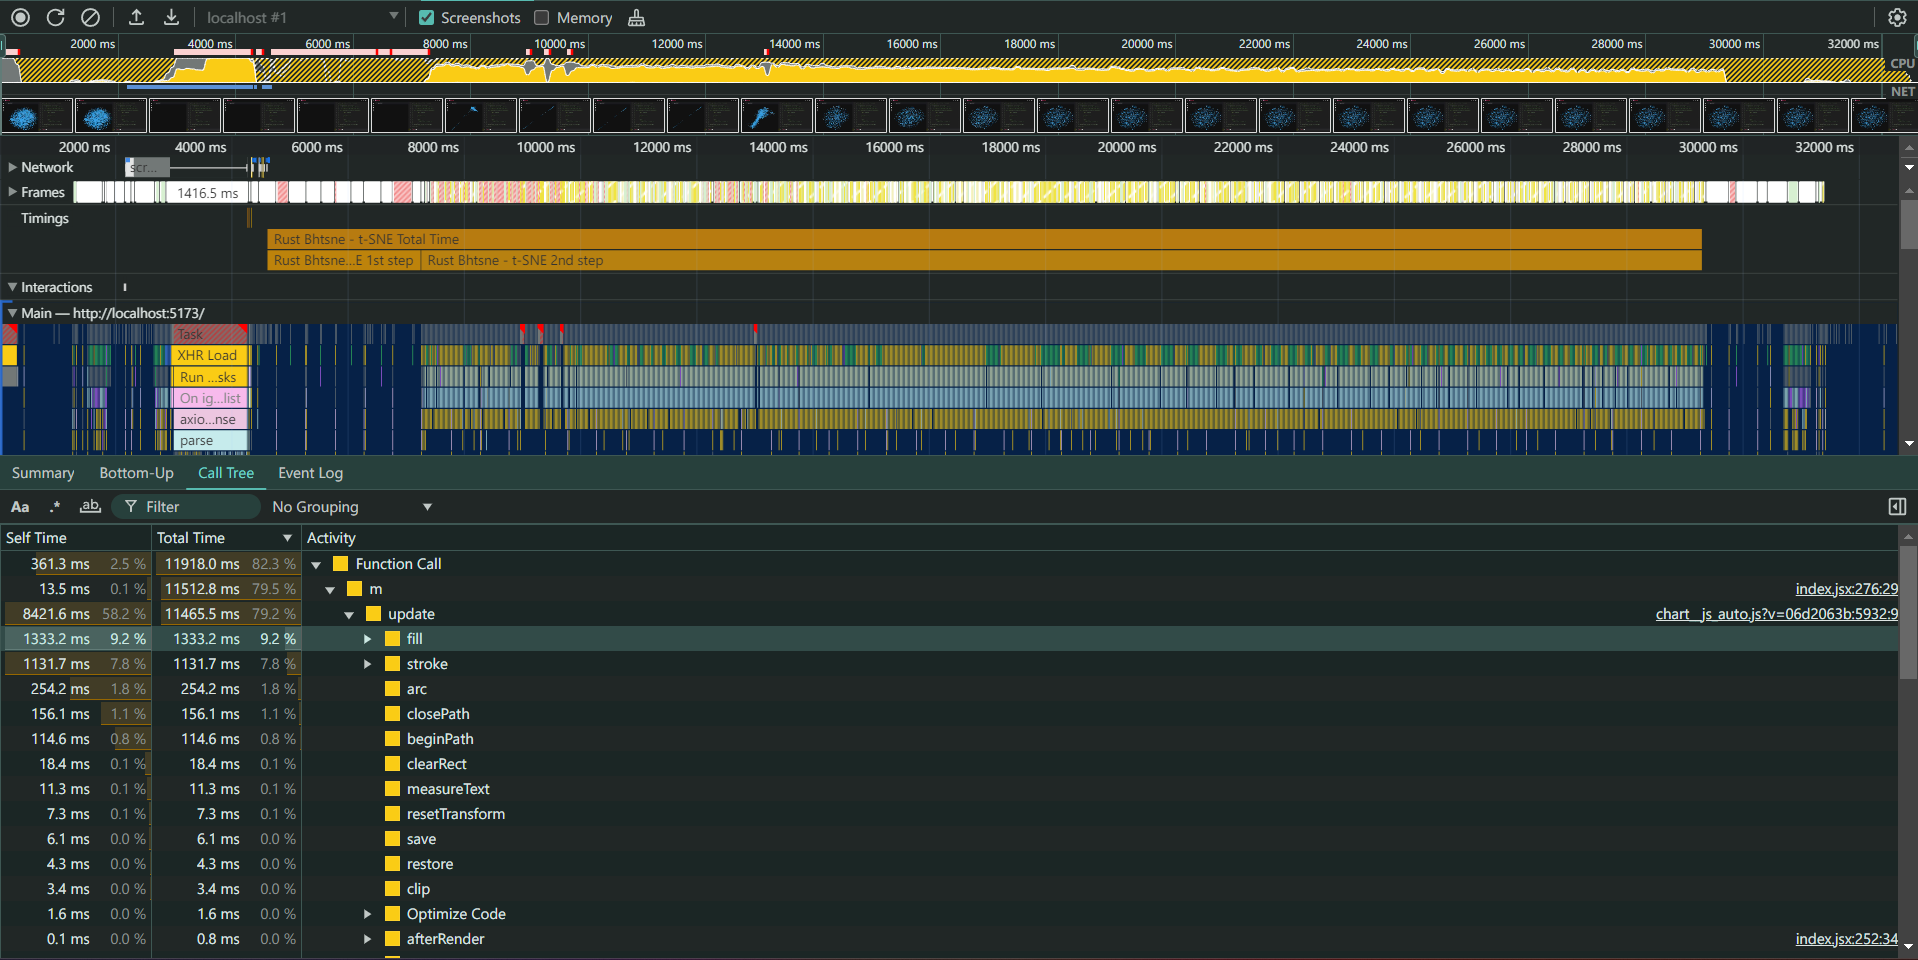
Profiling Result
Conclusion
Participating in the Qdrant Summer of Code 2024 was a deeply rewarding experience. I had the chance to push the boundaries of my coding skills while exploring new technologies like Rust and WebAssembly. I’m incredibly grateful for the guidance and support from my mentor and the entire Qdrant team, who made this journey both educational and enjoyable.
This experience has not only honed my technical skills but also ignited a deeper passion for optimizing performance in real-world applications. I’m excited to apply the knowledge and skills I’ve gained to future projects and to see how Qdrant’s enhanced vector visualization feature will benefit users worldwide.
This experience has not only honed my technical skills but also ignited a deeper passion for optimizing performance in real-world applications. I’m excited to apply the knowledge and skills I’ve gained to future projects and to see how Qdrant’s enhanced vector visualization feature will benefit users worldwide.
Thank you for joining me on this coding adventure. I hope you found something valuable in my journey, and I look forward to sharing more exciting projects with you in the future. Happy coding!