Vector Search in Production: Scaling, HA & Tuning Guide
David Myriel
·April 30, 2025

What Does it Take to Run Search in Production?
A mid-sized e-commerce company launched a vector search pilot to improve product discovery. During testing, everything ran smoothly. But in production, their queries began failing intermittently: memory errors, disk I/O spikes, and search delays sprang up unexpectedly.
It turned out the team hadn’t adjusted the default configuration settings or reserved dedicated paths for write-ahead logs. Their vector index was too large to fit comfortably in RAM, and it frequently spilled to disk, causing slowdowns.
Issues like these underscore how default configurations can fail spectacularly under production loads.
Running vector search in production is about ensuring reliability, performance, and resilience—no matter your hosting environment. Managing memory constraints, configuring data distribution, indexing choices, and backups are crucial whether you’re on bare metal, virtual machines, or orchestrated containers.
This Guide Addresses Most Common Issues in Production

Whether you’re planning your first deployment or looking to improve an existing system, this walkthrough will help you build resilient and high-performing vector search infrastructure.
This article will help you successfully deploy and maintain vector search systems in production environments.
Drawing from real-world experiences of our users, you’ll discover practical techniques to avoid common pitfalls that have derailed many production deployments.
Table of Contents
1. How Can You Get the Best Search Performance?

| “Search got super slow after we added more vectors.” |
❓ Use Case: A customer support startup saw intermittent latency spikes. Their index outgrew available memory, so disk fetches became frequent. Upgrading their RAM helped, and quantizing all the data became the real game-changer. All it took for the user was to manage their memory loads and to reduce in-memory vectors and oflload the rest onto the disk.
If this is happening to you, then your indexing settings are most likely not optimized, so the system is hitting the disk more often and driving up latency.
Ensure your hot dataset fits in RAM for low-latency queries.
If not, then you’ll have to offload data ‘on_disk’. If this parameter is enabled, Qdrant caches your most frequently accessed vectors loaded into RAM, and the rest is memory-mapped onto the disk.
This ensures minimal disk access during queries, significantly reducing latency and boosting overall performance. By monitoring query patterns and usage metrics, you can identify which subsets of your data deserve dedicated in-memory storage, reserving disk access only for colder, less frequently queried vectors.
| Read More: Storage Documentation |
Index Your Important Metadata to Avoid Costly Queries
✅ You should always create payload indexes for all fields used in filters or sorting.
Many users configure complex filters but may not be aware of the need to create corresponding payload indexes.
As a result, every query scans thousands of vectors and their bare payloads before discarding the majority that failed the filter condition. This leads to soaring CPU usage and long response times, especially under higher traffic loads.
Filtering after retrieving thousands of vectors can get expensive. If you don’t filter with your queries, then Qdrant will evaluate more vectors than you need. This will make the entire system slower and more resource intensive. Because of this, we have developed out own version of HNSW - The Filterable Vector Index.
Unlike some other engines, Qdrant lets you make the optimal choice of which fields to index for your use case rather than creating indexes for every field by default.
Note: Don’t forget to use the correct payload index type. If there are numeric values, the you must use a numeric index. If you represent numbers in strings (“123”), a numeric index will not work.
| Read More: Filtering Documentation |
Don’t Forget to Tune HNSW Search Parameters
| “Our results aren’t relevant enough, or they take too long to compute.” |
Sometimes users don’t properly balance HNSW search parameters. Setting the HNSW ef parameter to a very low value like zero would result in extremely fast responses (around one millisecond), but the results would be of poor quality.
❓ Use Case: A customer ran advanced similarity searches across their vast dataset of nearly 800 million vectors. Initially, they found that queries took anywhere from 10 to 20 seconds, especially when combining multiple filters and metadata fields.
✅ How can they retain accuracy and keep things fast? The answer is optimization.
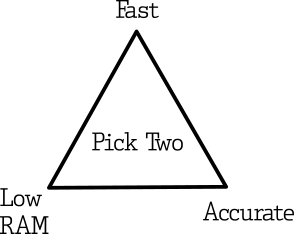
Figure 1: Qdrant is highly configurable. You can configure it for speed, precision or resource use.
By dialing in ef, the team discovered a sweet spot where sub-second responses became feasible, yet accuracy remained solid. They also fine-tuned other aspects of the database, such as placing quantized vectors in RAM while offloading original, uncompressed vectors to disk.
This strategy balanced memory usage with performance: only the compact vectors needed to be in memory for fast lookups, while the larger ones stayed on disk until required.
| Read More: Optimization Guide |
| Read More: HNSW Documentation |
Compress Your Data with Quantization Strategies
| “We’re using too much memory for our massive dataset.” |
Many users skip quantization, causing their index to consume excessive RAM and produce uneven performance. Some users hesitate to compromise precision, but this is not always the case.
If your workload can tolerate a moderate drop in embedding precision, data compression offers a powerful way to shrink vector size and slash memory usage. By converting high-dimensional floating-point values into lower-bit formats (such as 8-bit scalar or even a single bit-sized representations), you can keep far more vectors in RAM while reducing disk footprint.
✅ You should evaluate and apply quantization if your use case allows. Quantization seriously improves performance and reduces storage costs.
This not only speeds up query throughput for large-scale datasets, but also cuts hardware costs and storage overhead. While Scalar Quantization is a midrange compression alternative, Binary quantization is more drastic, so be sure to test your accuracy requirements for each thoroughly.
When using quantization, you can store only the compressed vectors in memory while leaving the original floating-point versions on disk for reference. This approach dramatically lowers RAM consumption—since quantized vectors take far less space—yet still allows you to retrieve full-precision vectors if needed for downstream tasks like re-ranking.
Sidenote: You can always enable
async_ioscorer when the linux kernel supports it and if you haveon_diskvectors.
| Read More: Quantization Documentation |
2. How do I Ingest and Index Large Amounts of Data?

| “When I try to import a huge dataset, everything grinds to a halt.” |
❓ Use Case: A fintech team ingested 500 million transaction records. Performance was fine initially but collapsed within an hour.
They had left HNSW indexing enabled, so every insert triggered a full index update. Unfortunately, their CPU usage soared, and other services timed out.
✅ On a case-by-case basis, we recommend disabling building the HNSW index during large uploads to improve ingestion and indexing speed.
Once all records are inserted, you can rebuild the index in a single pass. Consider a specialized ingestion pipeline that batches writes and schedules indexing during low-traffic windows. If you don’t have such low-traffic windows, you can tune the indexing_threshold to find a balance between receiving updates without triggering indexation, and keeping the collection indexed.
| Read More: Configuring the Vector Index |
Other Solutions to Alleviate Indexing Bottleneck
✅ Increase indexing threads: If you’re using more than 16 cores, consider explicitly increasing the number of indexing threads.
By default, Qdrant uses up to 16 threads for indexing, but if you notice your CPU isn’t being fully utilized during indexing, you can increase this number.
✅ Use Batch Processes: Increase the number of concurrent processes. Running 50-60 processes can significantly improve upload performance. Using just one or two processes won’t allow you to see the true performance potential.
Be patient with indexing: After uploading large datasets, there’s a waiting period for indexing to complete. This is normal and can take time depending on your dataset size.
| Read More: Configuration Documentation |
When Indexing Falls Behind Ingestion

It’s possible for indexing to temporarily fall behind data ingestion, both during gradual streaming uploads and after large bulk uploads.
By default, searches include unindexed data. However, a large number of unindexed points can significantly slow down searches due to full scans, potentially causing high search latency, timeouts, and application failures.
If the maximum number of indexed points remains consistently low, this is likely not an issue. If you anticipate periods with many unindexed points, you should take measures to prevent search disruptions in production.
One option is to set indexed_only=true in search requests. This will ensure fast searches by only considering indexed data, at the expense of eventual consistency (new data becomes searchable only after indexing).
Alternatively, you can perform bulk vector uploads during low-traffic periods to allow indexing to complete before increased traffic.
A persistent increase in the number of indexed points indicates a problem. Potential solutions include: increasing hardware resources, optimizing indexing (e.g., smaller segments, HNSW tuning), or reducing the volume of data changes.
| Read More: Indexing Documentation |
How to Arrange Metadata and Schema for Consistency
| “My filters aren’t working the same way every time.” |
In some cases, the payload schema is inconsistent across data pipelines, so some fields have mismatched types or are missing altogether.
❓ Use Case: A healthcare firm discovered that some pipelines inserted strings where others inserted integers. Filters broke silently or returned inconsistent results, signalling that a unified payload schema was not in place.
When payload fields are typed inconsistently across your ingestion pipelines, filters can break in unpredictable ways.
For example, some services might write a “status” field as a string (“active”) while others insert it as a numeric code (1). As a result, queries that expect uniform data might silently fail, skip important records, or produce incorrect sorting/filtering.
✅ Ensuring your payload schema is consistently enforced, whether through strict type checking or a well-defined data contract, is the best way to prevent this mismatch. It’s also important to log any schema violations during ingestion, giving you a chance to fix errors before they degrade query performance and result quality.
| Read More: Payload Documentation |
Decide How to Set Up a Multitenant Collection
❓ Use Case: When implementing vector databases, healthcare organizations need to ensure isolation between users’ data. Our customer needed to make sure that when they filtered queries to only show a particular patient’s documents, and no other patient’s documents appeared in the query results.
✅ You should almost always consolidate tenants to a single collection if possible, tagging by tenant.
PUT /collections/{collection_name}/index
{
    "field_name": "group_id",
    "field_schema": {
        "type": "keyword",
        "is_tenant": true
    }
}
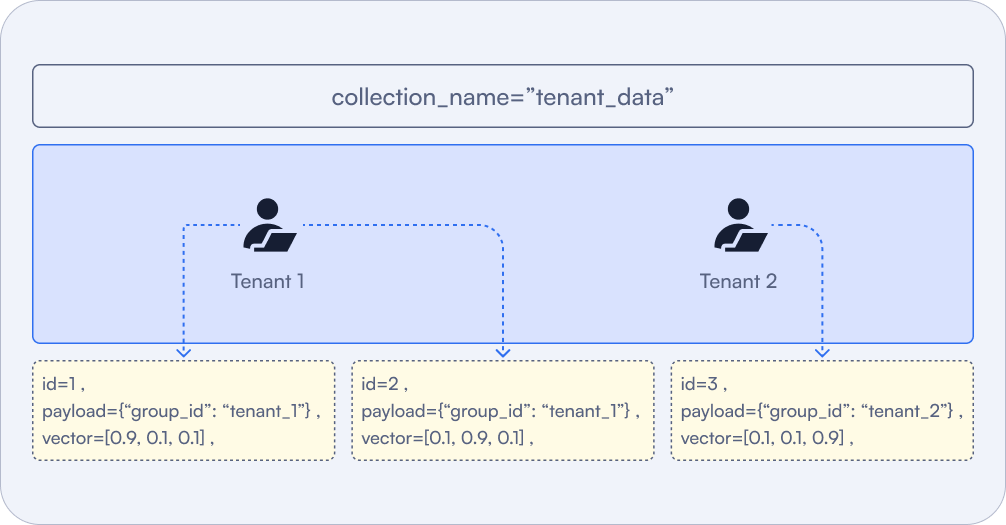
Figure: For many-tenant setups, spinning up a new collection per tenant can balloon overhead. A multitenant design—using a single collection with a tenant field—uses resources more efficiently.
Don’t forget: you can always create API keys in Qdrant Cloud (or JWT in OSS) to enforce a certain filter via a payload constraint.
| Read More: Multitenancy Documentation |
3. What’s the Best Way to Scale the Database and Optimize Resources?

| “How many nodes, CPUs, RAM and storage do I need for my Qdrant Cluster?” |
It depends. If you’re just starting out - we have prepared a tool on our website to help you figure this out. For more information, check out the Capacity Planning document as well.
✅ Use the sizing calculator or performance testing to ensure node specs (RAM/CPU) match your workload.
Overestimating wastes resources, while underestimating leads to slow queries or out-of-memory errors. By methodically testing realistic workloads, you can confidently match hardware specs to your target ingestion rate, query volume, and dataset size.
Preparing for High Availability Scenarios in Production
✅ Use at least 3 nodes to ensure failover and reduce downtime risk.
A three-node setup provides a baseline for fault tolerance: if one node goes offline, the remaining two can continue serving queries and maintain a quorum for data consistency. This guards against hardware failures, rolling updates, and network disruptions. Fewer than three nodes leaves you vulnerable to single-point failures that can knock your entire cluster offline.
We follow the Raft Protocol, so check out the docs and learn why this is important.
✅ Set a replication factor of at least 2 to tolerate node failure without losing availability.
PUT /collections/{collection_name}
{
    "vectors": {
        "size": 300,
        "distance": "Cosine"
    },
    "shard_number": 6,
    "replication_factor": 2
}
Replication ensures that each piece of data is stored on multiple nodes. If one node fails, another replica can step in to serve reads and writes. This prevents data loss and maintains uninterrupted service for critical applications. A replication factor of 2 or higher is particularly important for production workloads where uptime and reliability are non-negotiable.
✅ Isolate production from dev/staging—use separate clusters to avoid noisy neighbors.
Development and staging environments often run experimental builds, tests, or simulations that can spike resource usage unpredictably. Running these alongside production can degrade performance and stability, impacting real users. By hosting production on a dedicated cluster, you can safeguard critical workloads from development-induced slowdowns and ensure more consistent, reliable performance.
Dealing With Imbalanced or Overworked Nodes
| “One of my nodes is doing way more work than the others.” |
❓ Use Case: A SaaS platform added hundreds of new customers. Suddenly, latencies spiked because one node was handling 5 times the load. A specific sharding scheme funneled certain “hot” data to just one shard.
It’s quite possible that the user has multiple shards on one node, which end up handling most traffic while other nodes remain underutilized.
In this case, you should choose the right number of shards based on your node count and expected RPS.
You need to implement a shard strategy that aligns with real usage patterns. First, distribute your shards across all available nodes. This will help balance the load more effectively. After redistributing the shards, run performance tests to see how it affects your system. Then add replicas and test again to see how that changes performance.
Your sharding strategy also depends on how many collections you have. A single collection is arguably easier to balance, because there is less to move/balance. Also, a single collection also has the least amount of overhead/orchestration.
How to shard?
Proper sharding considers data distribution and query patterns. By default, shards are randomized for uniform distribution if queries always span the entire dataset. If certain tenants or geographical regions get hammered with traffic, you might partition by cluster, by payload (tenant ID) or a custom shard distribution.
| Read More: Sharding Documentation |
Manage Your Costs by Scaling Up or Down

Some teams scale up for daytime surges, then scale down overnight to save resources. If you do this, ensure data is sharded and replicated appropriately, so that scaling up and down won’t result in service degradation.
If using Qdrant Cloud you could also do this using the Replication Factor, though it may be considered a bit of a hack.
If you have 3 nodes with just 1 shard, and replication factor 6. It will create 3 replicas (one on each node) of that shard, because it can’t host more. If you add 3 more nodes at peak times, it’ll automatically replicate that shard 3 more times in an attempt to match the factor of 6.
If you scale down again, the extra replicas will be dropped.
✅ Reshard collections after scaling up your cluster to rebalance data and avoid OOMs.
When you add nodes to your cluster, existing replicas rebalance themselves with new shards, but only with a fixed number - which may not fully take advantage of the new hardware. As a result, the original nodes remain overloaded while new nodes sit mostly idle. By resharding collections after scaling, you redistribute data evenly across the cluster, preventing hot spots that can lead to out-of-memory (OOM) conditions on overburdened nodes.
If new nodes remain empty after joining, you waste resources. If departing nodes leave behind un-migrated data, you risk partial coverage or even data loss.
Note: This is only available in Qdrant Cloud as well as Hybrid & Private Clouds, and not when self hosting.
| Read More: Distributed Deployment Documentation |
| Read More: Resharding |
How to Predict and Test Cluster Performance
| “I had no idea something was wrong until it was too late.” |
Such issues tend to occur when users don’t monitor resource usage, search performance, or security. Critical failures went undetected until users complained.
✅ Run load tests under expected traffic conditions to identify bottlenecks before go-live.
You need to set a plan to use realistic data for your load tests. Ideally, you should test with production traffic or historical data that closely resembles your actual workload. This provides more accurate results than randomly generated test data, as it will better represent real-world usage patterns and data distributions.
Design your load test to gradually increase traffic until you reach or exceed your expected production load. For example, if you expect 1000 requests per second (RPS) in production, incrementally scale up your test to reach this threshold while monitoring latency. Responses will separately show server timing for granular monitoring.
You should test system performance after restarts to understand cold-start behavior. Initial queries after a restart may be significantly slower as caches need to be rebuilt. For example, a query might take 50-60 seconds initially but only 0.5 seconds on subsequent runs.
Remember, cold-starts and query behaviour are dataset dependent, which is why you should establish your own baselines and what to expect.
| Read More: Distributed Deployment Documentation |
How to Design Your Systems to Protect Against Failure
| “When one node crashed, our entire cluster went down.” |
Unfortunately, you didn’t plan for failover or chaos testing, so a single point of failure took out production. You should plan for hardware or node crashes by storing data redundantly, testing failovers, and running chaos experiments.
✅ Regularly test failures to reveal how your system recovers.
High concurrency and large memory footprints can expose misconfigurations more quickly, so regularly simulating failures reveals how your system recovers.
- Graceful Node Shutdowns: Drain queries, reassign shard ownership via load balancer.
- Redundant Data Paths: Store data on multiple volumes or in multiple locations.
- Load Tests: Generate high concurrency or large queries to mimic real surge patterns.
Set up Telemetry for Early Detection
❓ Use Case: A customer in health care uses telemetry data from their Qdrant deployment to identify performance and scaling issues with their open-source implementation. The telemetry helps them monitor metrics such as search performance, RAM utilization efficiency, and indexing speed. By analyzing this data, they can work toward reducing query response times and optimize their system configuration.
✅ Enable telemetry and monitoring so you can track latency, throughput, and optimization stats.
Telemetry is vital. You need to collect metrics such as search latency distribution, CPU usage, disk throughput, and memory consumption. If memory usage is at 90% during index building, that’s a clear sign you need more capacity or more nodes.
Build dashboards that monitor CPU usage, memory consumption, disk I/O, and indexing speeds help you catch resource bottlenecks. Otherwise, you learn of problems only when latency spikes or logs fill with errors.
What to Monitor?
For retrieval, focus on P99 latency metrics (the response time for the slowest 1% of requests) rather than just average latency. This gives you a better understanding of worst-case performance.
For hardware, monitor resource utilization during tests. If you’re not seeing expected CPU utilization (e.g., only 2 out of 8 CPUs being used), there may be configuration issues limiting performance. Test different configurations to find optimal settings for your specific workload.
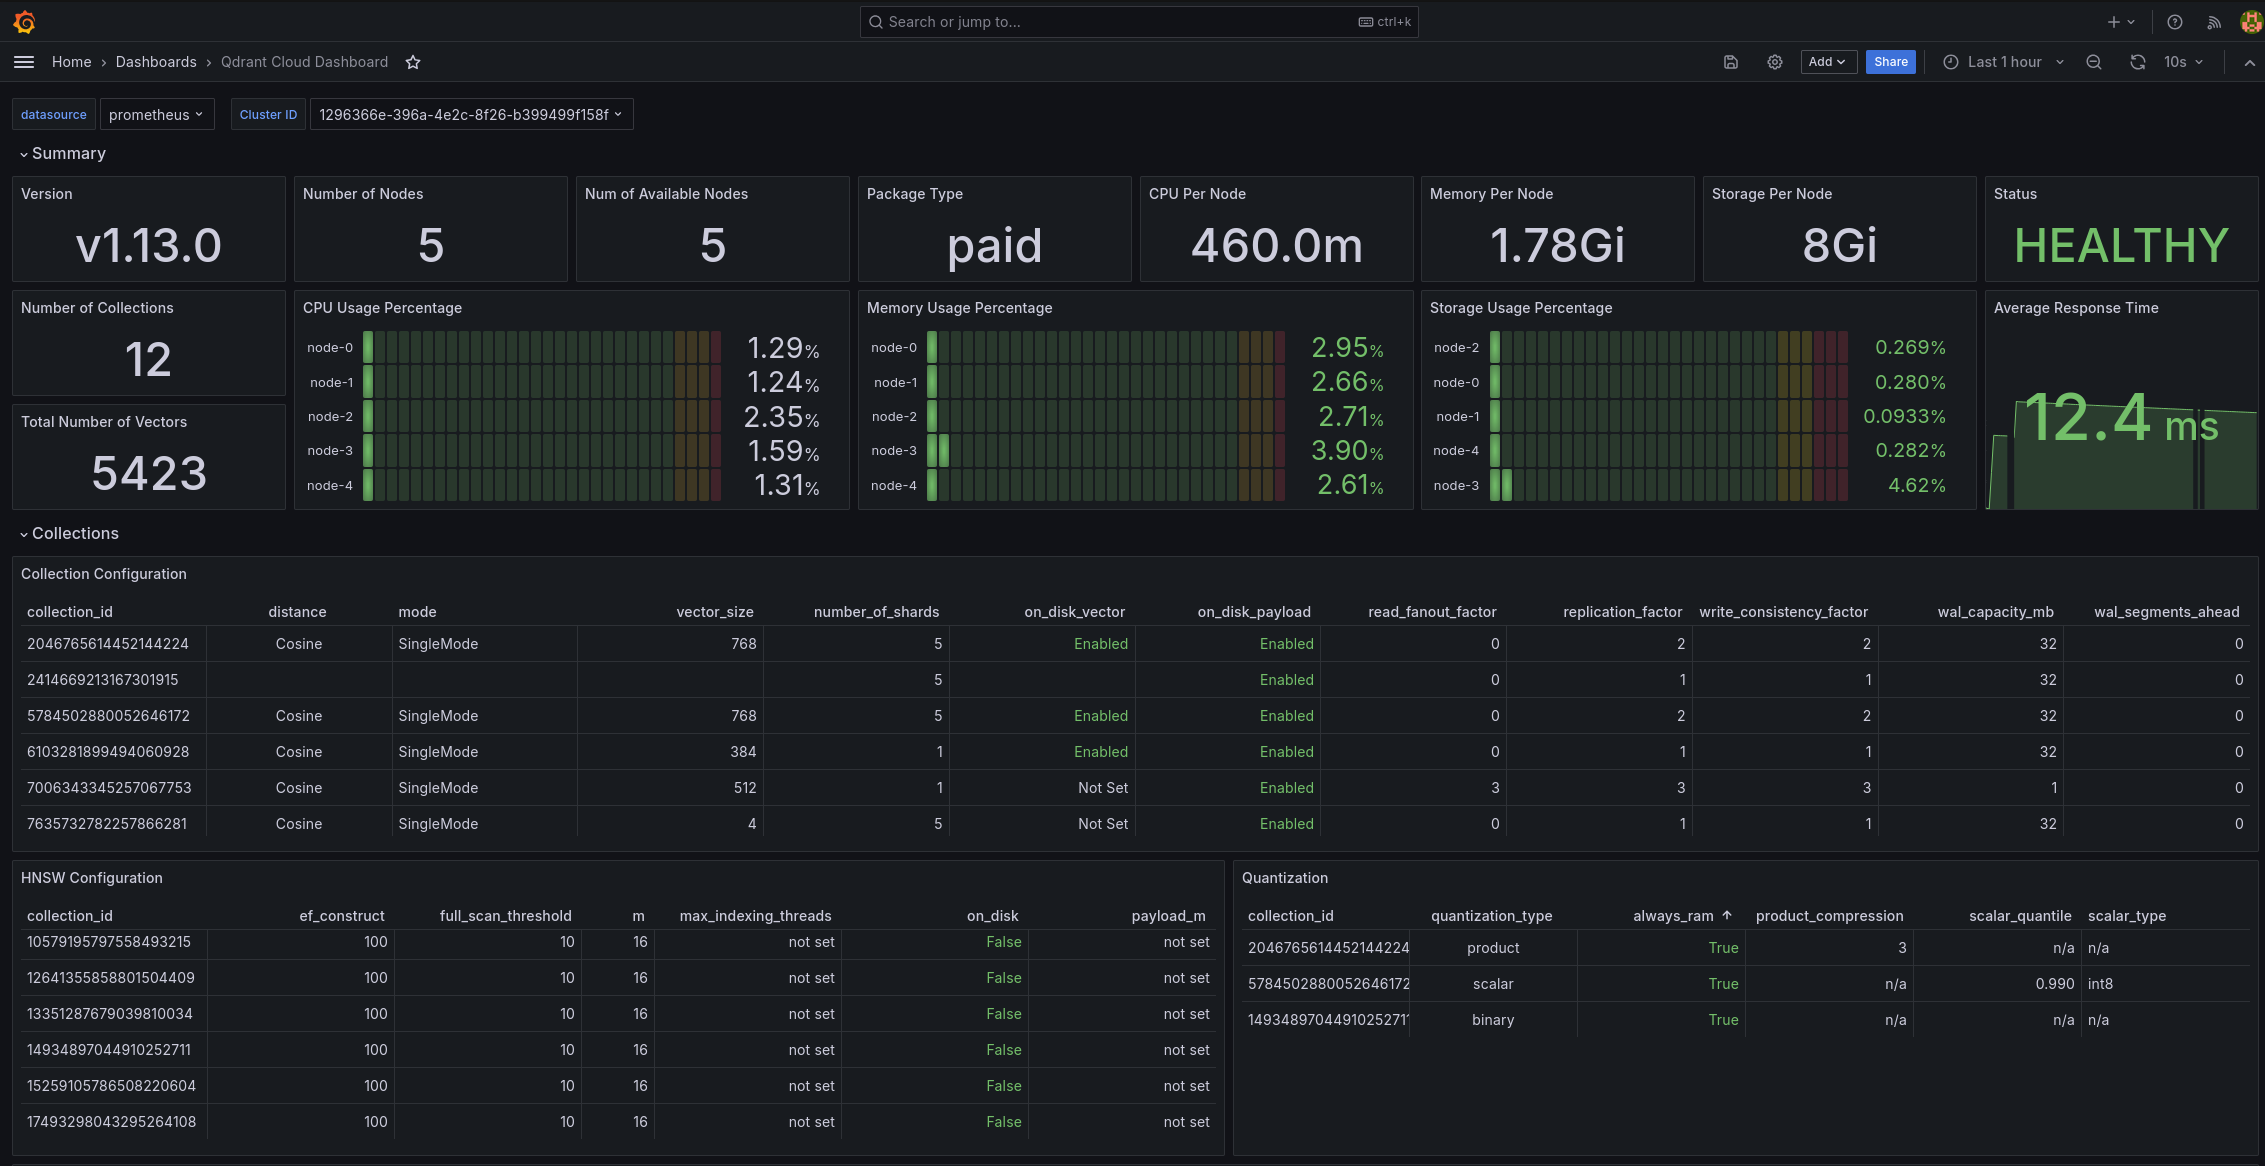
Figure: If you are scrape monitoring, networking and logging metrics into your own monitoring system, you can use our Grafana dashboard to visualize these metrics.
Include tests that combine both read and write operations to simulate real-world usage. For example, you might configure a test with 80% reads and 20% writes to match your expected production workload.
By following these comprehensive load testing practices, you’ll be able to identify and address potential bottlenecks before your system goes live, ensuring a smoother launch and better user experience.
| Read More: Telemetry and Monitoring Documentation |
| Read More: Cloud Monitoring Documentation |
4. Ensuring Disaster Recovery With Database Backups and Snapshots

| “I tried to restore a snapshot, and now everything’s broken.” |
❓ Use Case: A digital publisher endured a catastrophic outage and attempted to restore from backups. They discovered an index format mismatch only after partial data was lost. Another company saw query performance drop when snapshot compression hogged CPU during peak traffic.
Some of our users unfortunately never tested backups, so they only discovered version mismatches or partial/incremental backups missing data at the worst time - during restoration.
Full Backups or Snapshot Restores?
For disaster recovery scenarios, you should use full backups instead of snapshots. Snapshots are primarily designed for moving data between clusters, whereas backups are intended for recovering the entire state of a cluster.
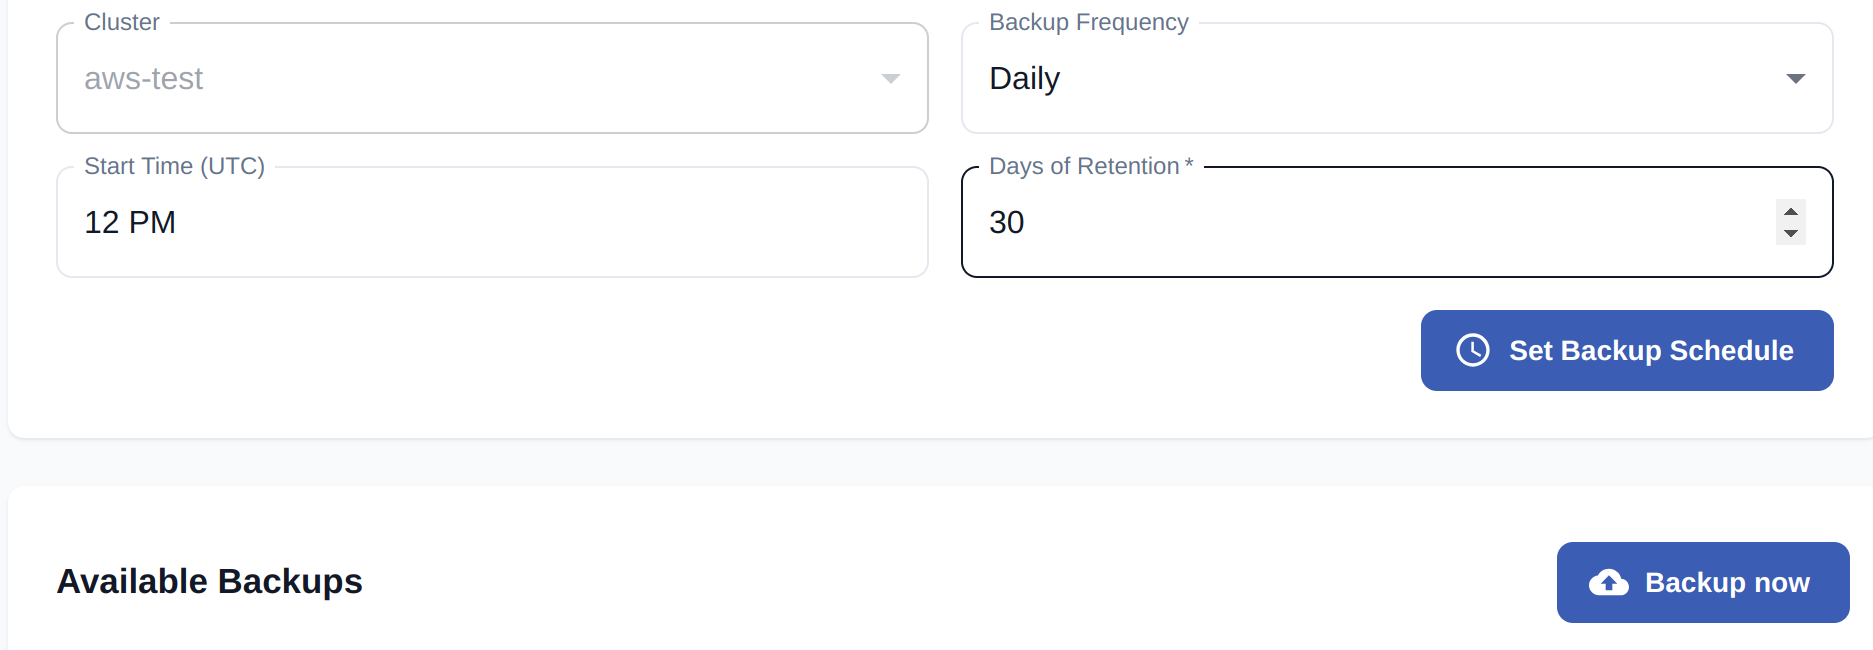
Figure: Configuring a cluster backup from the Qdrant Cloud UI
With full backups you copy the entire dataset, including indexes and other configuration. This is great for completeness, but can be expensive and time-consuming. Full snapshot recovery is faster, but more complex to coordinate and restore the entire state.
Snapshots are convenient because they create an archive of a collection or, at a more granular level, an archive of a shard that you can download and upload to another instance. Use this if you don’t want to go through the long process of indexing.
✅ Set up regular snapshots or backups and verify they can be restored if needed.
Whichever you choose, always test the restore process. Some teams only realize backups are incomplete or corrupt when a real disaster hits.
Best Ways To Backup Large Deployments
If you host tens of billions of vectors, store backups off-node in a different data center or a remote repository. Also, confirm your restore bandwidth is sufficient. If the restore pipeline is slower than the local disk, it’ll take far longer than expected.
To avoid mismatched versions after restoration, always preserve index configurations, such as quantization settings or HNSW parameters.
| Read More: Snapshot Documentation |
| Read More: Managed Cloud Backup Documentation |
| Read More: Private Cloud Backup Documentation |
5. Tips for Proper Database Administration

| “I keep running out of memory and my service is crashing.” |
You most likely haven’t allocated enough CPU and memory to your database, or you haven’t matched your hardware resources to concurrency levels. In turn, the system will thrash or terminate under a heavy load.
❓ Use Case: A mid-sized e-commerce company piloted a vector search solution to improve product discovery. Everything ran smoothly in testing, but once in production, memory errors, disk I/O spikes, and query delays piled up.
Investigations showed they hadn’t adjusted the default configuration or reserved dedicated storage for write-ahead logs. Their index repeatedly spilled to disk due to insufficient RAM, hurting performance.
✅ Allocate memory and CPU that match your data volume and concurrency demands
Vector databases require careful resource management. If you don’t align memory, CPU, and disk settings with real workloads, you’ll face random slowdowns or partial failures under peak load. Sometimes that shows up as unpredictable latency. Other times, you’ll see severe resource contention saturating CPU or disk.
Note: Not enough CPU may just slow things down. Being out of memory can crash the system.
| Read More: Qdrant Configuration Documentation |
Security & Governance
Use Case: A manufacturing company created a “Super Chatbot” that relied on many organizational components. The company needed to ensure secure communication between their application components - and transfer of data was paramount.
✅ Enable TLS/HTTPS for encrypted traffic in production.
Enabling TLS/HTTPS is essential for meeting compliance requirements in regulated industries. This level of security is critical for companies that prioritize data privacy and security, such as those in finance, government and healthcare, helping to overcome potential security team objections.
You need to protect data in transit. To enable TLS/HTTPS for encrypted traffic in production, you need to configure secure communication between clients and your Qdrant database, as well as individual cluster nodes. This involves implementing Transport Layer Security (TLS) certificates to encrypt all traffic, preventing unauthorized access and data interception.
If self-hosting, you can set up encryption yourself by incorporating TLS directly from the configuration
service:
  # Enable HTTPS for the REST and gRPC API
  enable_tls: true

# TLS configuration.
# Required if either service.enable_tls or cluster.p2p.enable_tls is true.
tls:
  # Server certificate chain file
  cert: ./tls/cert.pem

  # Server private key file
  key: ./tls/key.pem
| Read More: Security Documentation |
Setting up Access Controls in Production
Use Case: A large enterprise needed to implement access controls where “team A is able to access only collection A, B and C but not collection D” in their Qdrant database.
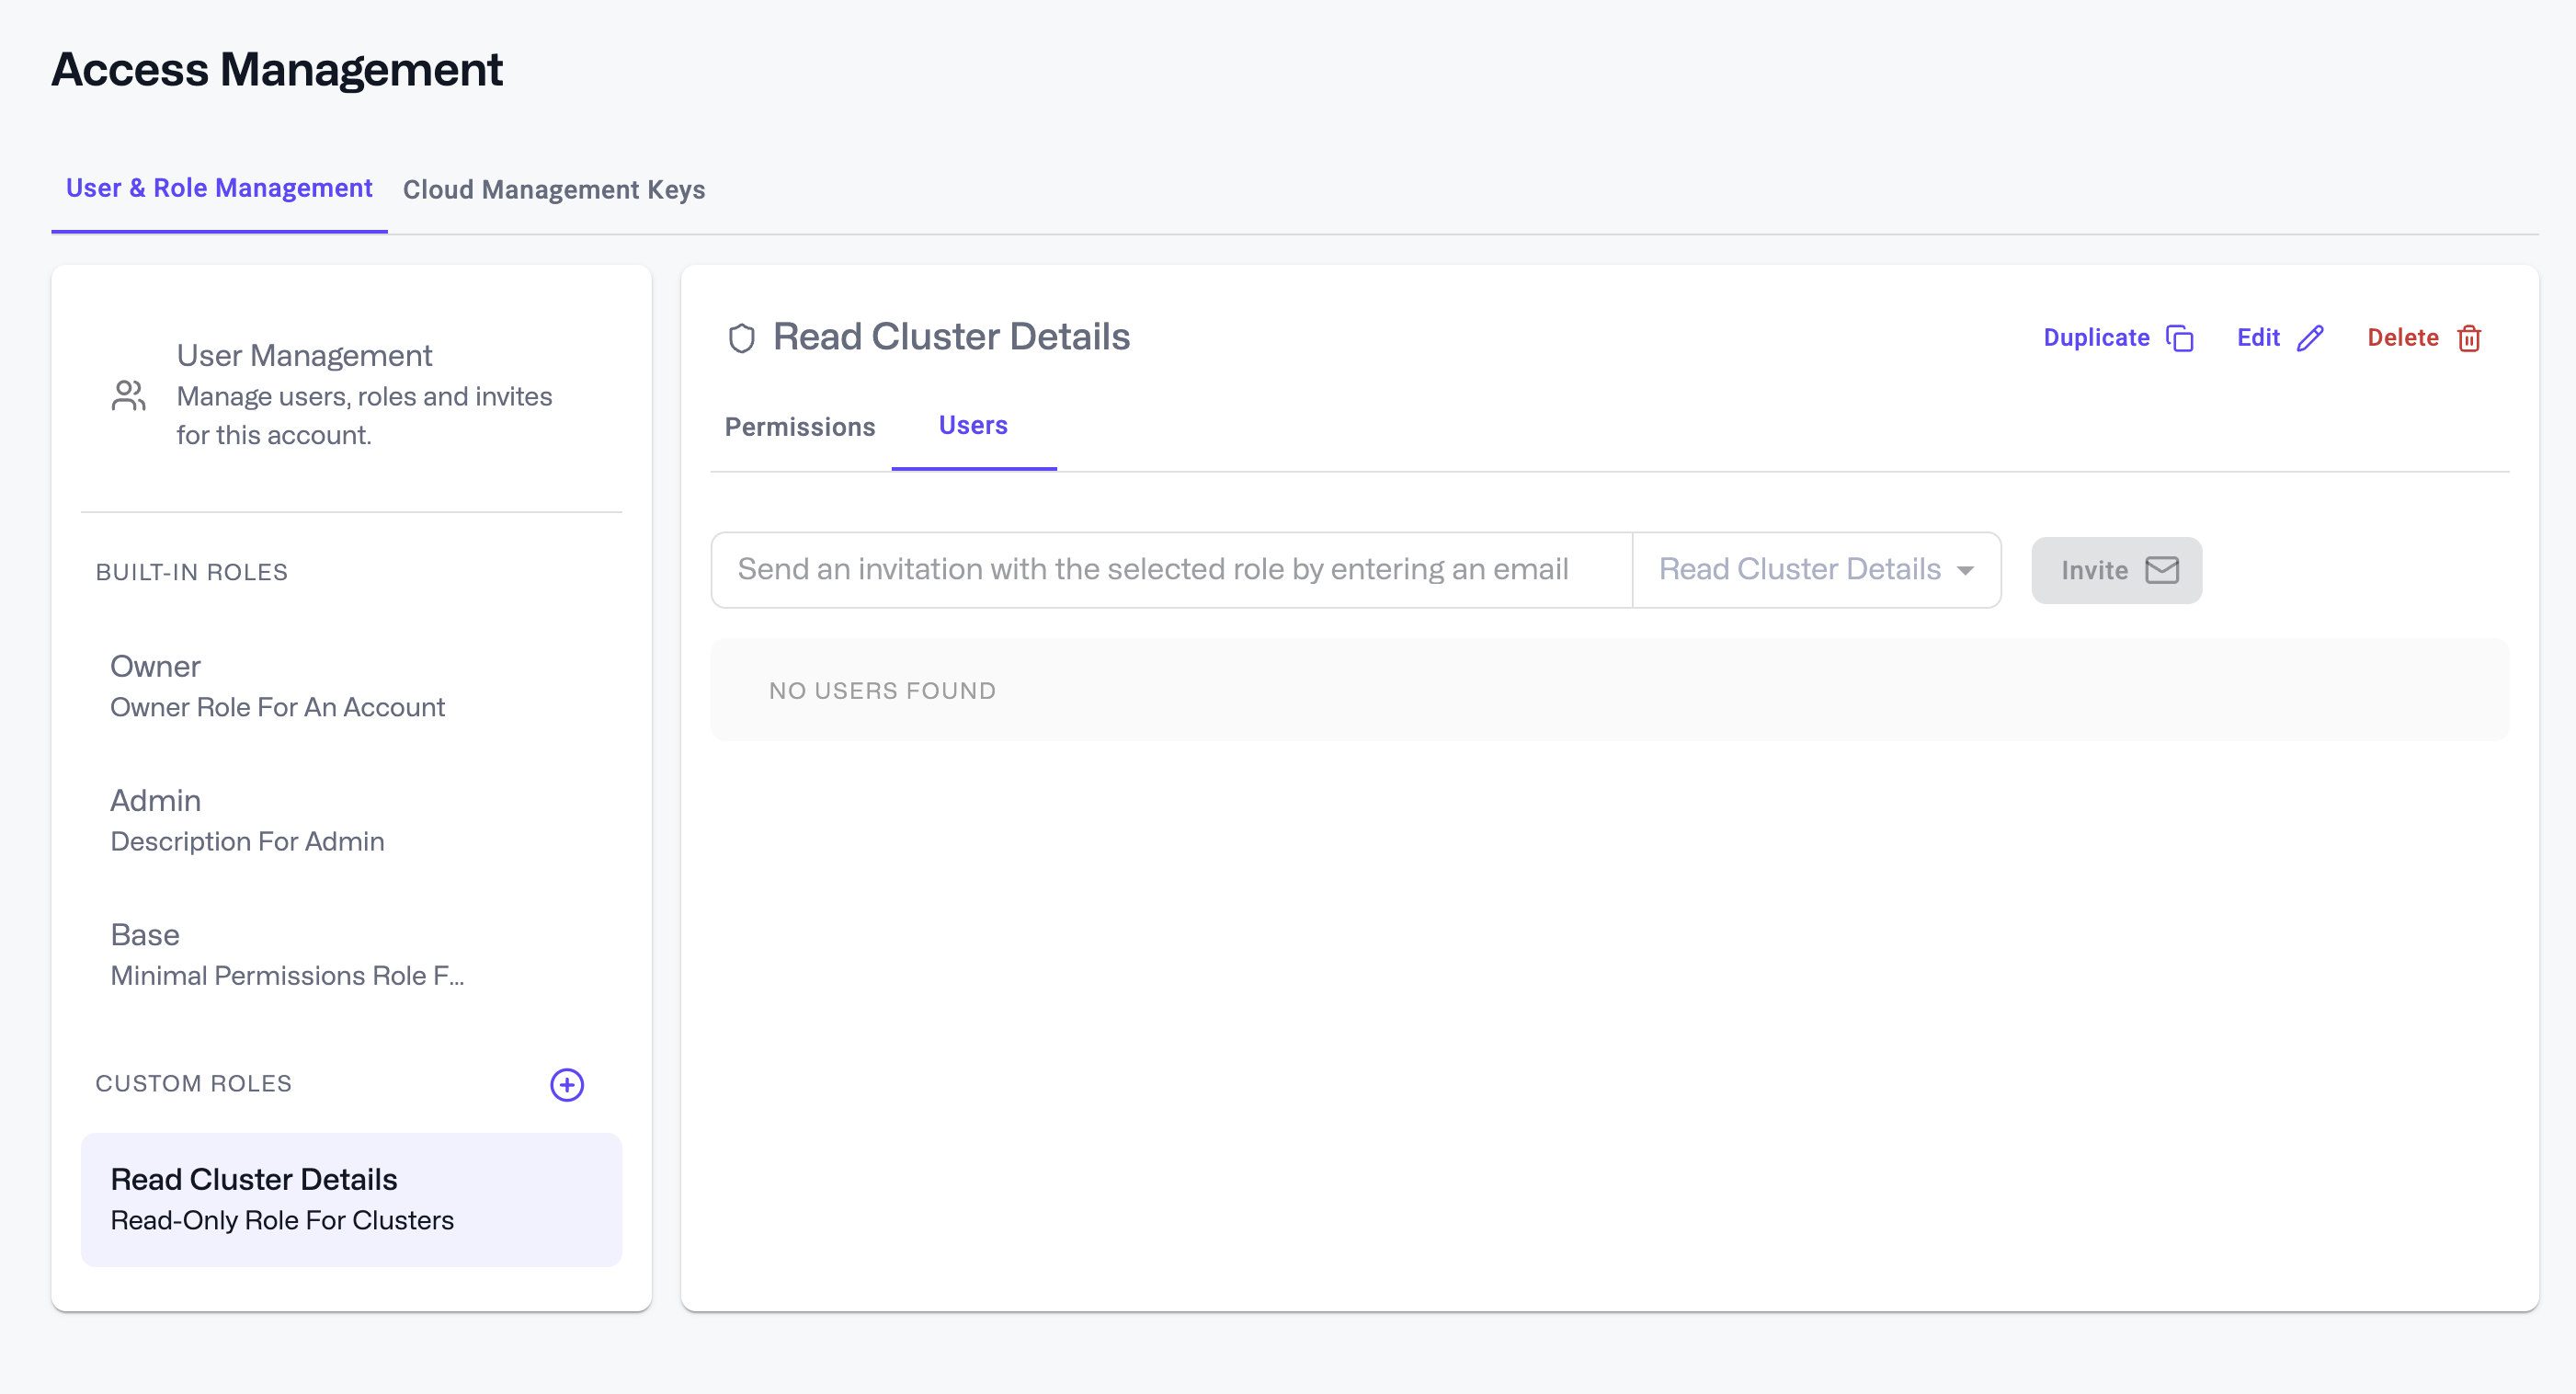
✅ Set up Role-Based Access Control (RBAC) to restrict actions by user or service.
Users can be invited attached to a specific role by inviting them through the Role Details page - just click on the Users tab and follow the prompts. Once accepted, they’ll be assigned that role’s permissions, along with the base role.
Figure: Qdrant Cloud’s interface for your database’s Role Based Access Control
✅ Use scoped API keys or auth tokens to avoid over-permissioned services.
For their private cloud implementation, they set up JWT tokens manually. They incorporated these JWT tokens into their existing Role-Based Access Control system. They created tokens with specific roles, responsibilities, and labels derived from their SSO system. This enabled them to control access at multiple levels, including multi-tenancy and access through metadata fields
✅ Follow Principle of Least Privilege when configuring access—only give permissions that are absolutely necessary.
For users of Qdrant’s managed cloud service, there’s an option to configure RBAC directly through the user interface, which automatically creates the role-based access control without requiring manual JWT configuration.
| Read More: Cloud RBAC Documentation |
Remember to Avoid These Common Pitfalls

❌ Don’t forget to index payload fields—not doing this will slow your search.
❌ Don’t run without replication—single-node setups are fragile.
❌ Don’t create a collection per user/customer—use multitenancy.
❌ Don’t run latency-critical search alongside heavy batch jobs—separate workloads.
❌ Don’t skip quantization—it can greatly reduce memory footprint and speed up searches.
❌ Don’t keep outdated Qdrant versions running—update regularly.
Conclusion
In conclusion, vector search in production isn’t tied to a specific cloud provider or infrastructure. The same core principles of careful configuration, robust ingestion/indexing, intelligent scaling, thorough backups, strong observability, and security apply universally. By embracing these fundamentals, you’ll deliver fast, reliable, and scalable search for your users, regardless of where your hardware or services run.