Configuring Networking, Logging & Monitoring in Qdrant Hybrid Cloud
Configure network policies
For security reasons, each database cluster is secured with network policies. By default, database pods only allow egress traffic between each other and ingress traffic to ports 6333 (REST) and 6334 (gRPC) from within the Kubernetes cluster.
You can modify the default network policies in the Hybrid Cloud environment configuration:
qdrant:
  networkPolicies:
    ingress:
    - from:
      - ipBlock:
          cidr: 192.168.0.0/22
      - podSelector:
          matchLabels:
            app: client-app
        namespaceSelector:
          matchLabels:
            kubernetes.io/metadata.name: client-namespace
      - podSelector:
          matchLabels:
            app: traefik
        namespaceSelector:
          matchLabels:
            kubernetes.io/metadata.name: kube-system
      ports:
      - port: 6333
        protocol: TCP
      - port: 6334
        protocol: TCP
Logging
You can access the logs with kubectl or the Kubernetes log management tool of your choice. For example:
kubectl -n qdrant-namespace logs -l app=qdrant,cluster-id=9a9f48c7-bb90-4fb2-816f-418a46a74b24
Configuring log levels: You can configure log levels for the databases individually in the configuration section of the Qdrant Cluster detail page. The log level for the Qdrant Cloud Agent and Operator can be set in the Hybrid Cloud Environment configuration.
Integrating with a log management system
You can integrate the logs into any log management system that supports Kubernetes. There are no Qdrant specific configurations necessary. Just configure the agents of your system to collect the logs from all Pods in the Qdrant namespace.
Monitoring
The Qdrant Cloud console gives you access to basic metrics about CPU, memory and disk usage of your Qdrant clusters.
If you want to integrate Qdrant metrics into your own monitoring system, configure it to scrape the following endpoints, which provide metrics in a Prometheus/OpenMetrics-compatible format:
/metricson port 6333 of every Qdrant database Pod. This provides metrics about each database and its internals./metricson port 9290 of the Qdrant Operator Pod. This provides metrics about the Operator, as well as the status of Qdrant clusters and snapshots./metricson port 9090 of the Qdrant Cloud Agent Pod. This provides metrics about the Agent and its connection to the Qdrant Cloud control plane./metricson port 8080 of the kube-state-metrics Pod. This provides metrics about the state of Kubernetes resources like Pods and PersistentVolumes within the Qdrant Hybrid Cloud namespace and is useful if you are not running kube-state-metrics cluster-wide.
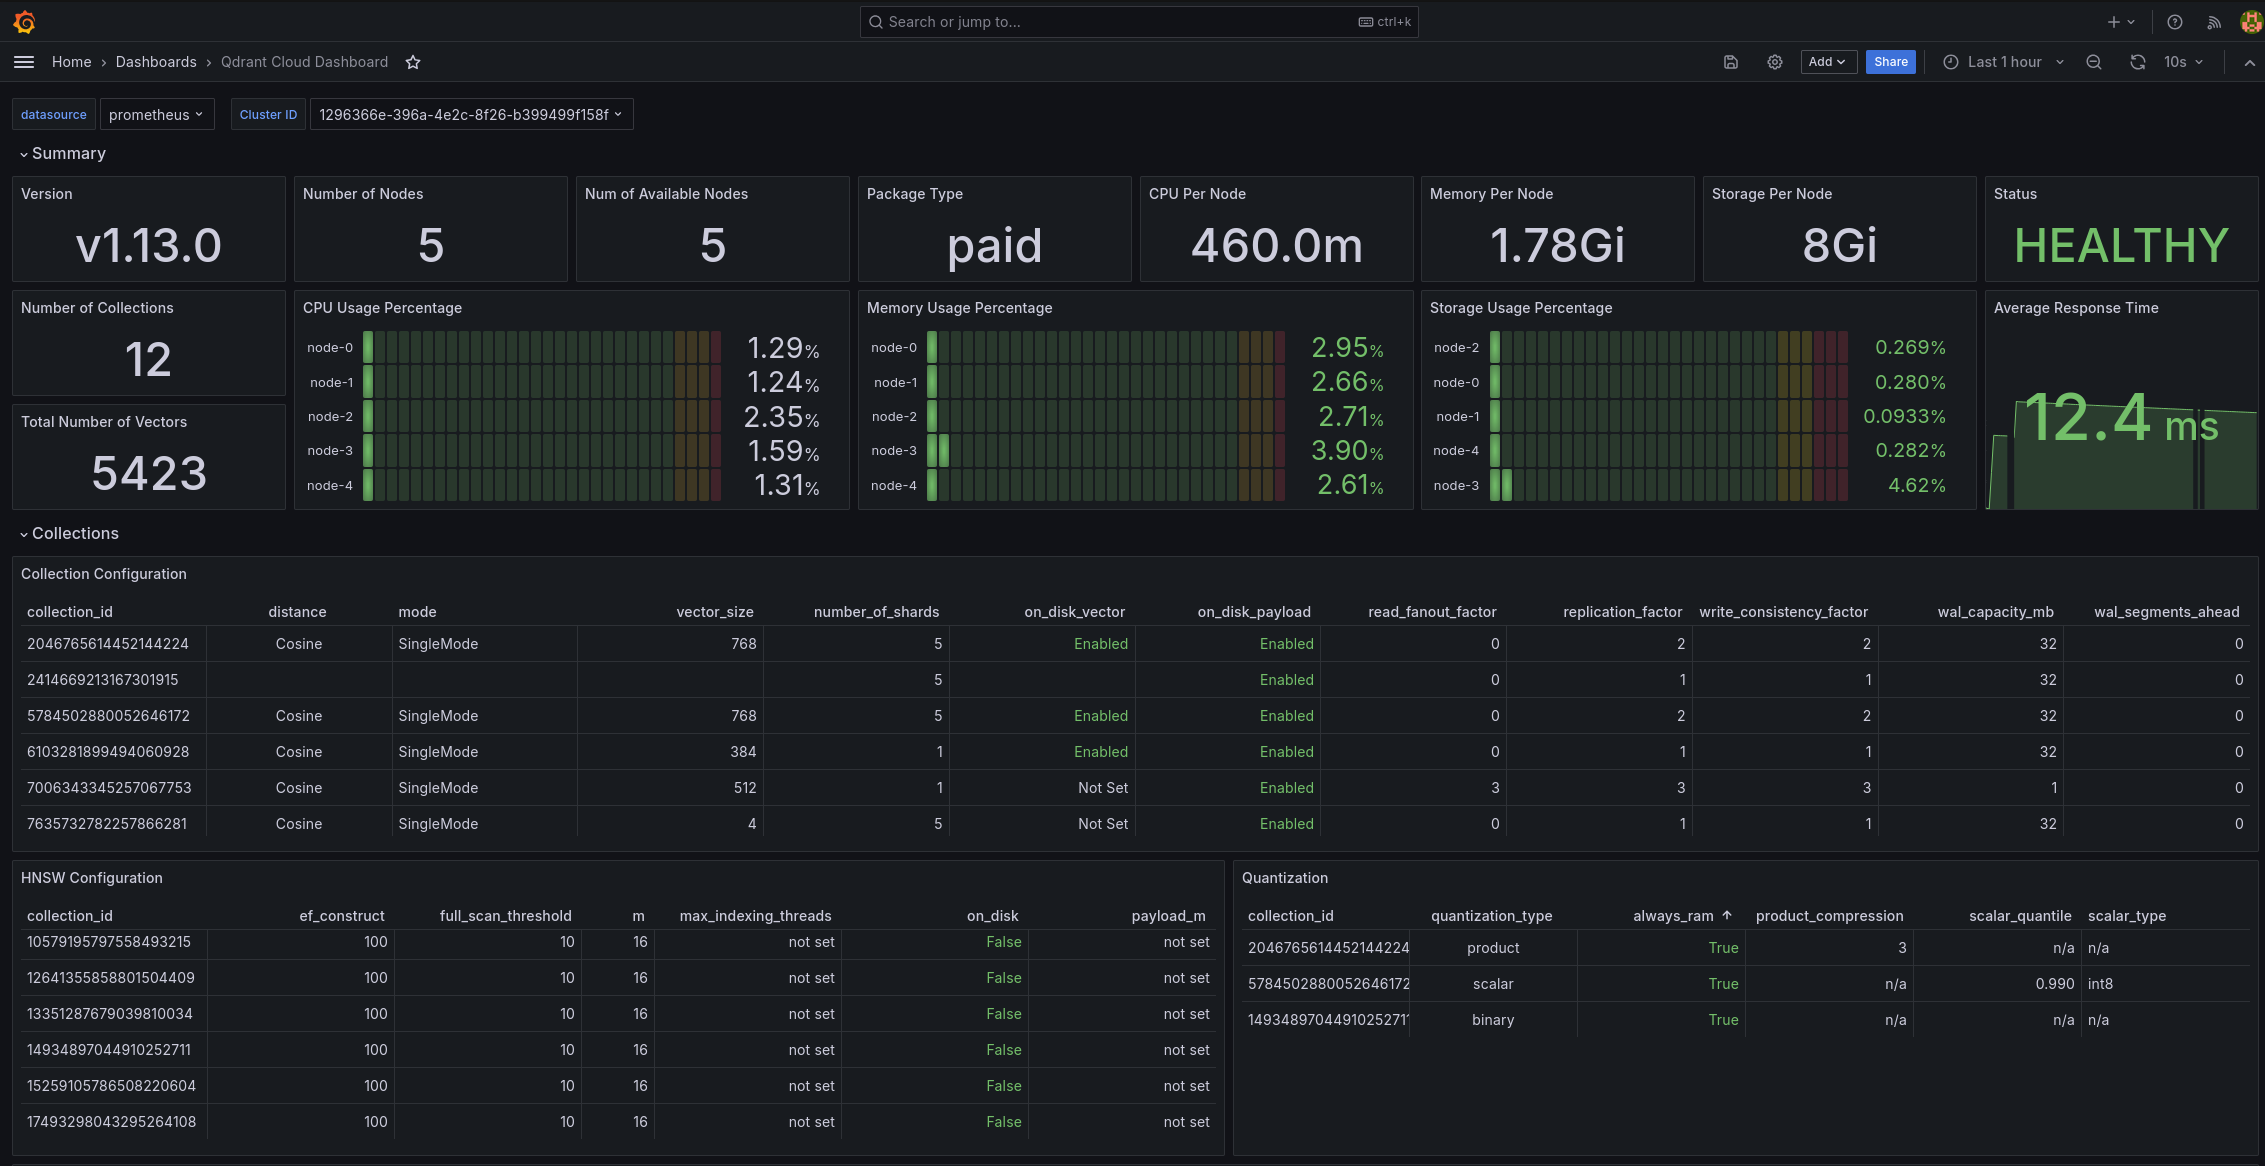
Grafana dashboard
If you scrape the above metrics into your own monitoring system, and you are using Grafana, you can use our Grafana dashboard to visualize these metrics.