


How Pento modeled aesthetic taste with Qdrant
Daniel Azoulai
·July 14, 2025
On this page:
Bringing People Together Through Qdrant
Taste in art isn’t just a preference; it’s a fingerprint.
Imagine you’re an artist or art enthusiast searching not for a painting, but for people who share your unique taste, someone who resonates with surrealist colors just as deeply as you, or who finds quiet joy in minimalist lines. How would a system know who those people are? Traditional recommenders often suggest what’s trending or popular, or just can’t understand the nuances of art.
In this post, we’ll build a recommender that does just that. By mapping user-art interactions into a semantic vector space, identifying clusters of preferences, and leveraging Qdrant’s powerful recommendation API, we’ll create a system that connects people not through popularity but through shared artistic preferences.
And while we’ll focus on art, the system is fundamentally universal. Replace artworks with podcasts, apartments, collaborators and the logic still holds. Once everything becomes a vector, the same pipeline can surface the right item for the right person, across nearly any domain.
The Problem with Traditional Recommenders
Most recommendation systems optimize for popularity, relying on techniques like collaborative filtering, assuming that users with similar behaviors have similar tastes. But in art, that assumption often breaks down. One person’s favorite painting might leave another cold. These responses are deeply personal and they shift. A user drawn to surrealism today might find solace in minimalism tomorrow. We need a system that listens inward, one that models taste as a dynamic, evolving landscape. And that’s what we’re building.
Modeling Aesthetic Taste Through Interaction
Aesthetic taste isn’t static, it drifts, deepens, and sometimes pivots entirely. These shifts often happen without conscious intention but they show up in patterns of interaction.
Each time a person engages with a piece of art, they’re leaving a signal that when seen individually, these signals might seem small. But over time, they begin to trace a shape, a kind of emotional fingerprint.
Most systems try to compress this shape into a single vector. But human taste doesn’t belong in a straight line. It’s layered, multi-faceted, and often contradictory. A person can love abstraction and realism. A truly expressive model should reflect that.
To capture this richness, we treat each user not as a single point in space, but as a collection of varied points, clusters that evolve as their relationship with art evolves through time. Each cluster will be weighted differently depending on how recent and frequent the interactions are.
How the System Works
Interaction acquisition
Each time a user opens the platform, we present a curated set of paintings and invite them to rate every piece on a 0-to-5 scale. These ratings capture the user’s level of interest in each artwork.
Behind the scenes, we convert every raw rating ri into a signed weight wi= ri-,
where is a tunable “neutral” threshold (default = 2.5). Scores above ( wi>0 ) signal positive affinity; scores below ( wi<0 ) indicate negative preference.
If users systematically choose the upper end of the scale we simply raise to keep the split between positive and negative signals balanced.
Artwork Embeddings
At the heart of this system is the ability to understand art, not through keywords or categories, but through the image itself. Each piece of art is transformed into a vector using an image encoder that captures not just form and color, but style, visual tone, and composition. The image encoder can be a pre-trained encoder for visual tasks or, even better, a fine-tuned model that captures painting styles.
The result is a high-dimensional embedding that places artworks into a semantic space where similar pieces, whether in style, subject, period, or color palette, are positioned close to one another, even across stylistic boundaries. These embeddings become the foundational layer for everything that follows: clustering, scoring, and ultimately, artist recommendation.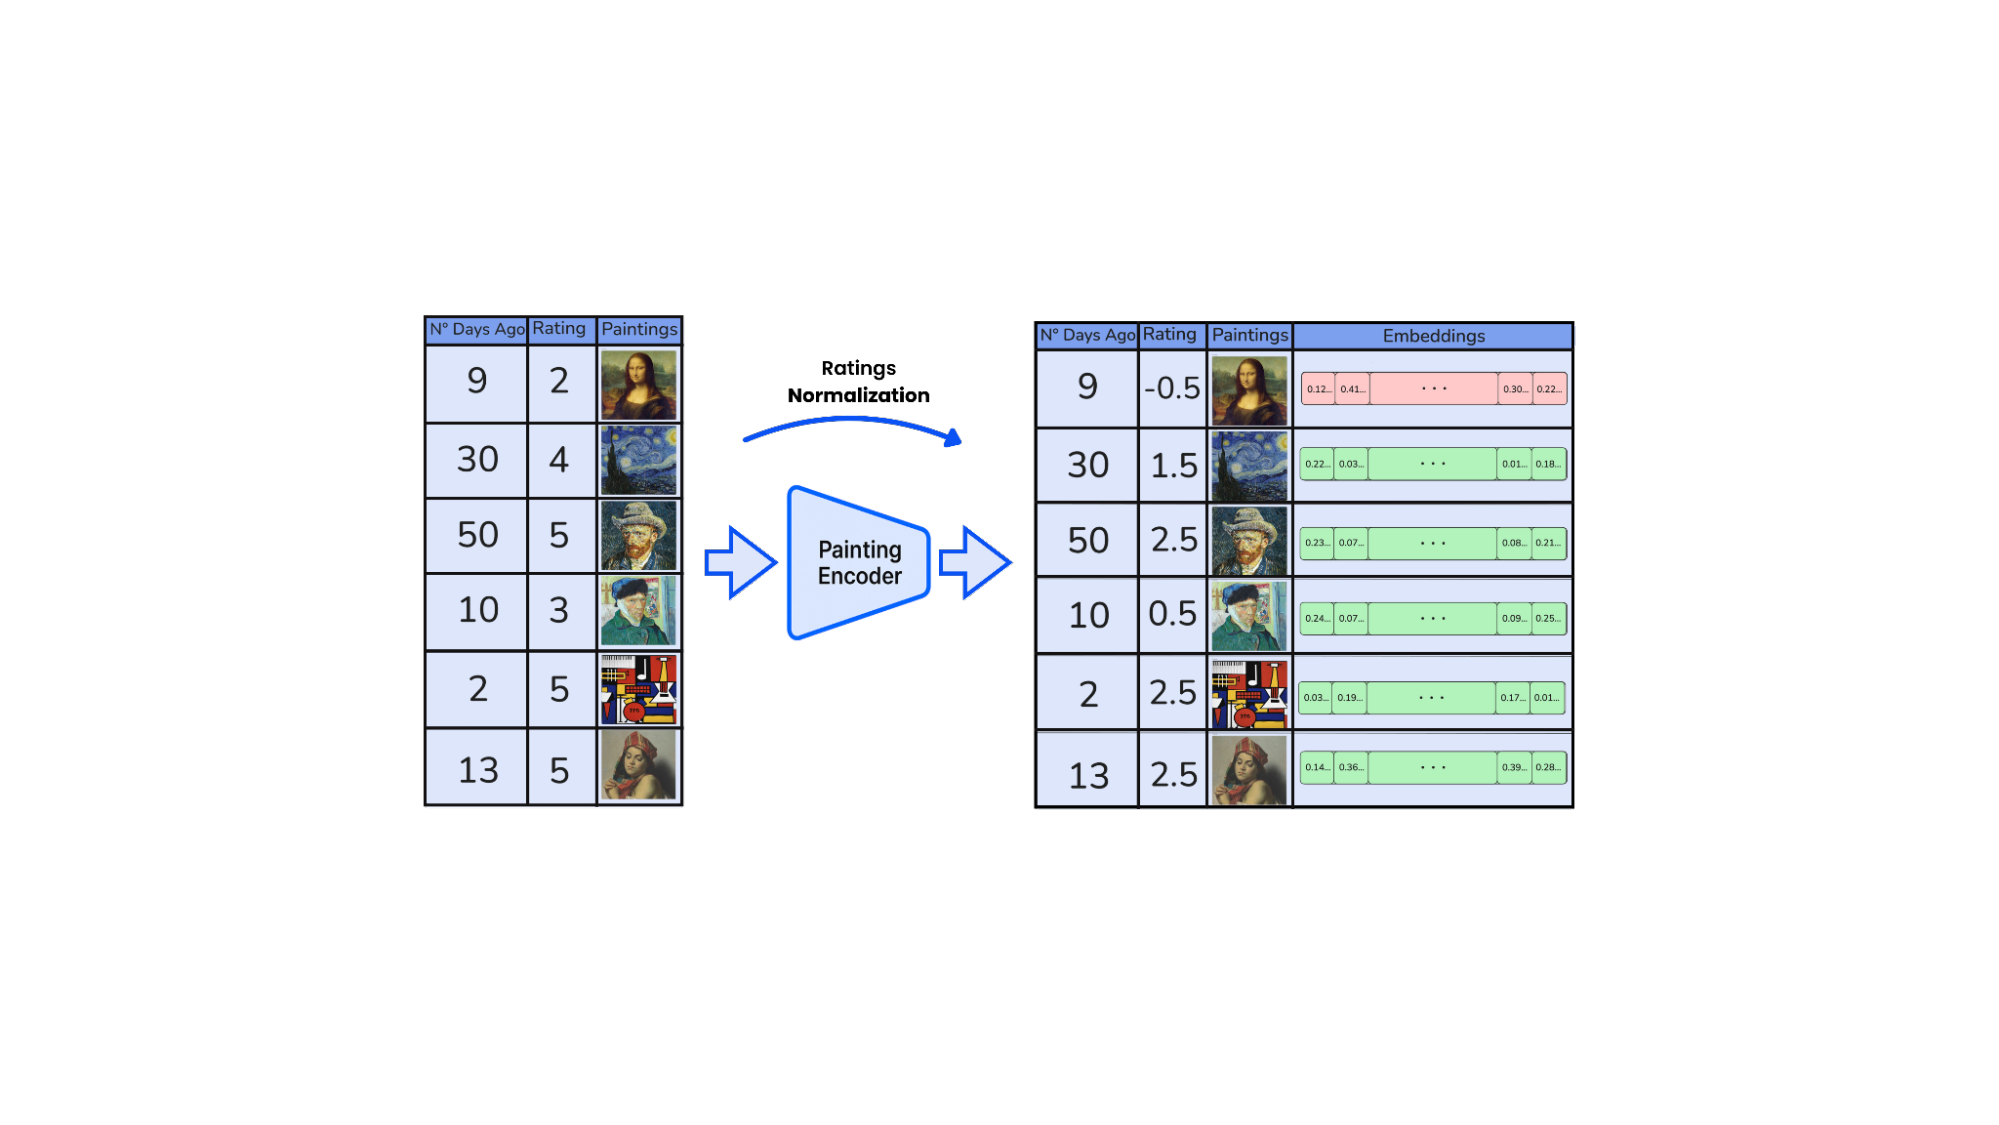
Interaction Clustering with HDBSCAN
Once each artwork is embedded, we turn to the user, not as a static profile, but as a series of moments. Each interaction with a piece of art becomes a point in embedding space, forming a cloud of visual preferences.
To uncover structure within this cloud, we use HDBSCAN, a density-based clustering algorithm that, unlike k-means, doesn’t require a predefined number of clusters. This is crucial when modeling aesthetic taste, which is rarely uniform. A single user might respond to romanticism, brutalist architecture, and vaporwave all at once, or in phases.
We split interactions into two sets:
- Positive interactions: interactions with a wi>0 (in green)
- Negative interactions: interactions with wi<0 (in red)
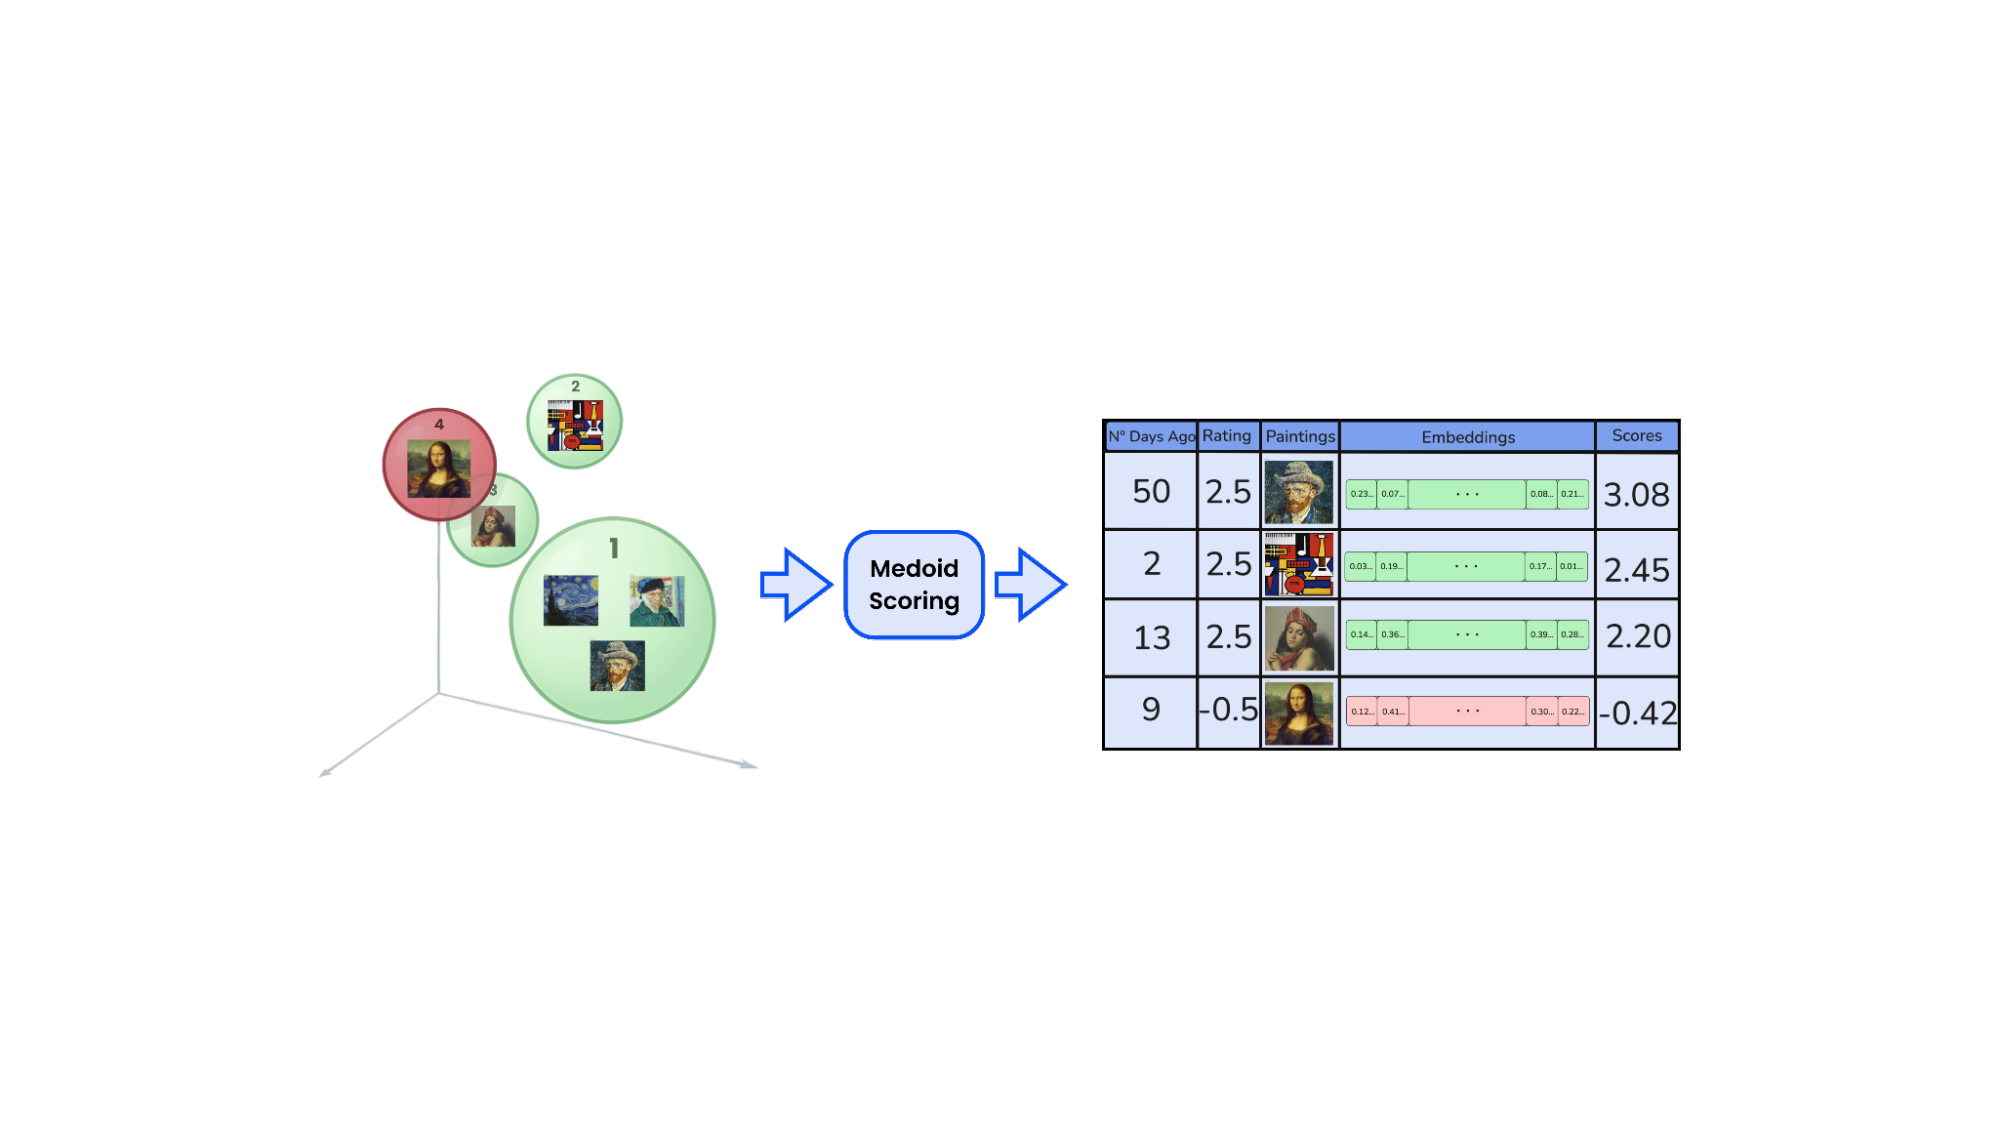
Each set is clustered independently using HDBSCAN. This results in multiple localized regions in embedding space that reflect coherent aesthetic themes.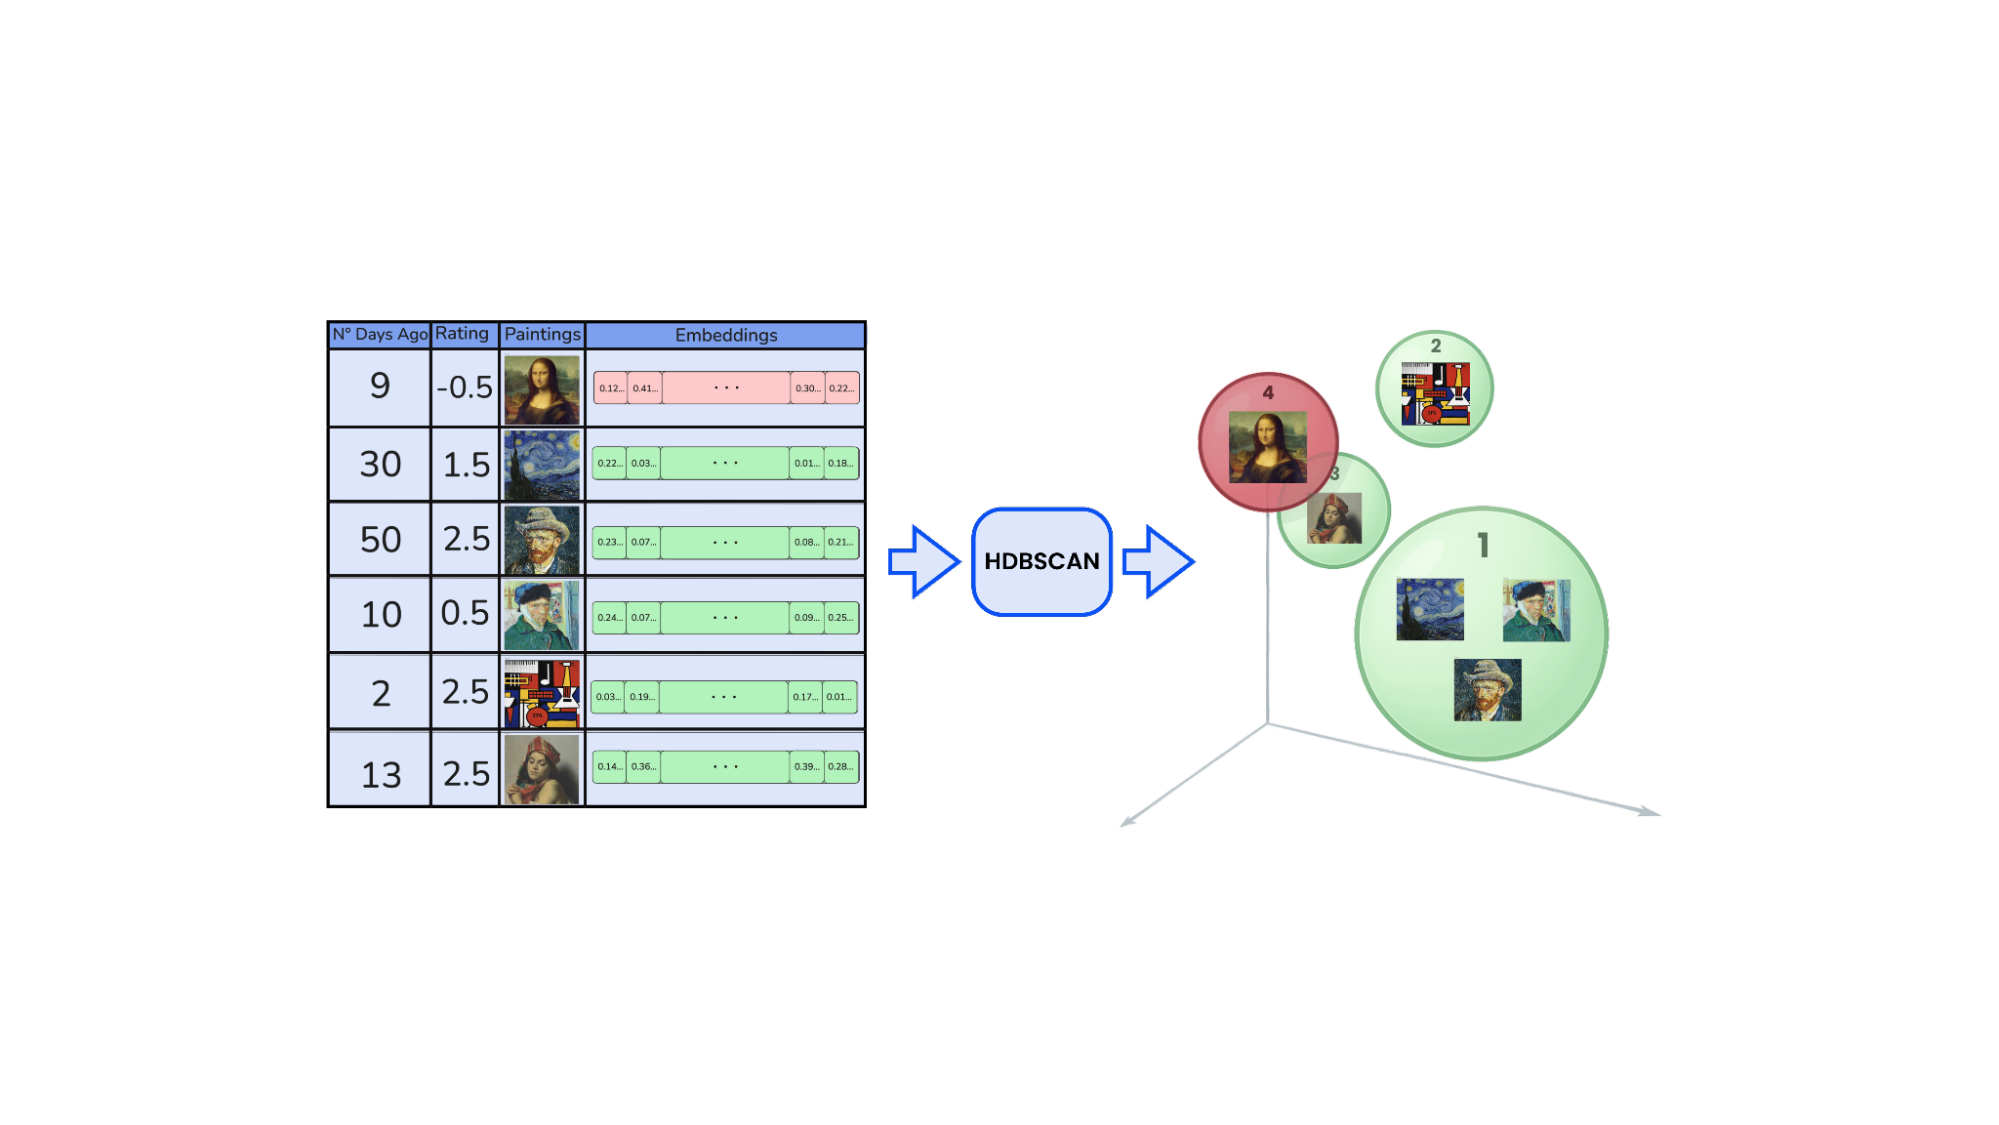 Each cluster is represented by its medoid, the most central, representative embedding in that group. These medoids become the core building blocks of the user’s taste profile.
We use medoids instead of centroids because centroids are the mean of all embeddings in the cluster, which may not correspond to any actual sample and can be influenced by outliers or non-linear distances in the embedding space. In contrast, the medoid is an actual data point that best represents the cluster while preserving the true structure of the original space, especially important when working with non-euclidean distances like cosine similarity.
Let us clarify that clearly we don’t have to use the entire user history, we can look back a certain amount of time to consider the last interactions. This time threshold will depend on how often users interact on the platform and how many interactions you have at a time.
Scoring Taste Clusters by Recency
Not all tastes carry the same weight, especially over time. A cluster of artworks a user connected with months ago may no longer reflect their current preferences. To account for this, we assign a recency-aware score to each cluster, emphasizing freshness without discarding history.
Each cluster is scored based on the timestamps of the interactions it contains, using an exponential decay function: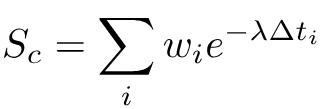
Where:
- wi is the normalized rating calculated before
- 𝚫ti is the time elapsed since interaction i
- Recent interactions contribute more than older ones
- Larger clusters naturally accumulate more weight, unless they are stale
- λ is a number between 0 and 1, the former weighs equally all occurrences independently of when they occurred and the latter gives more importance to recent events. We use λ=0.01 for this example.
This scoring method captures two dimensions at once:
- Recency: Newer preferences rise to the top
- Strength: Clusters with more activity gain importance
The result is a dynamic prioritization of tastes. Clusters representing fleeting interests fade naturally. Those tied to long-term engagement remain prominent.
To maintain the agility of the system and to avoid an excess of likes per user, we only keep 50% of the groupings based on their recency-weighted score |Sc|. This is done to represent users by their predominant tastes and the 50% is purely a business decision. By discarding smaller or outdated clusters, we focus on the strongest and most recent signals of interest, ensuring that recommendations are precise and meaningful. While this trade-off reduces recall by potentially missing some weaker matches, it significantly boosts precision by prioritizing what truly resonates with the user.
User Representation as Multivectors
Once clusters are identified and scored, we distill a user’s taste into something compact, expressive, and ready for retrieval: a multivector representation learn more about multivectors representations in Qdrant.
Each positively scored cluster contributes its medoid vector, a single embedding that represents the core of that aesthetic preference. We do the same for negatively scored clusters, treating them as regions the user tends to avoid.
This gives us two sets of vectors per user:
- Positive multivector: the user’s top taste clusters, ranked by recency-weighted importance
- Negative multivector: clusters of rejected content
Together, these sets describe not just what the user resonates with, but also what they tend to reject. It’s a more nuanced, contrastive view of preference and one that’s especially powerful when used with Qdrant’s vector search.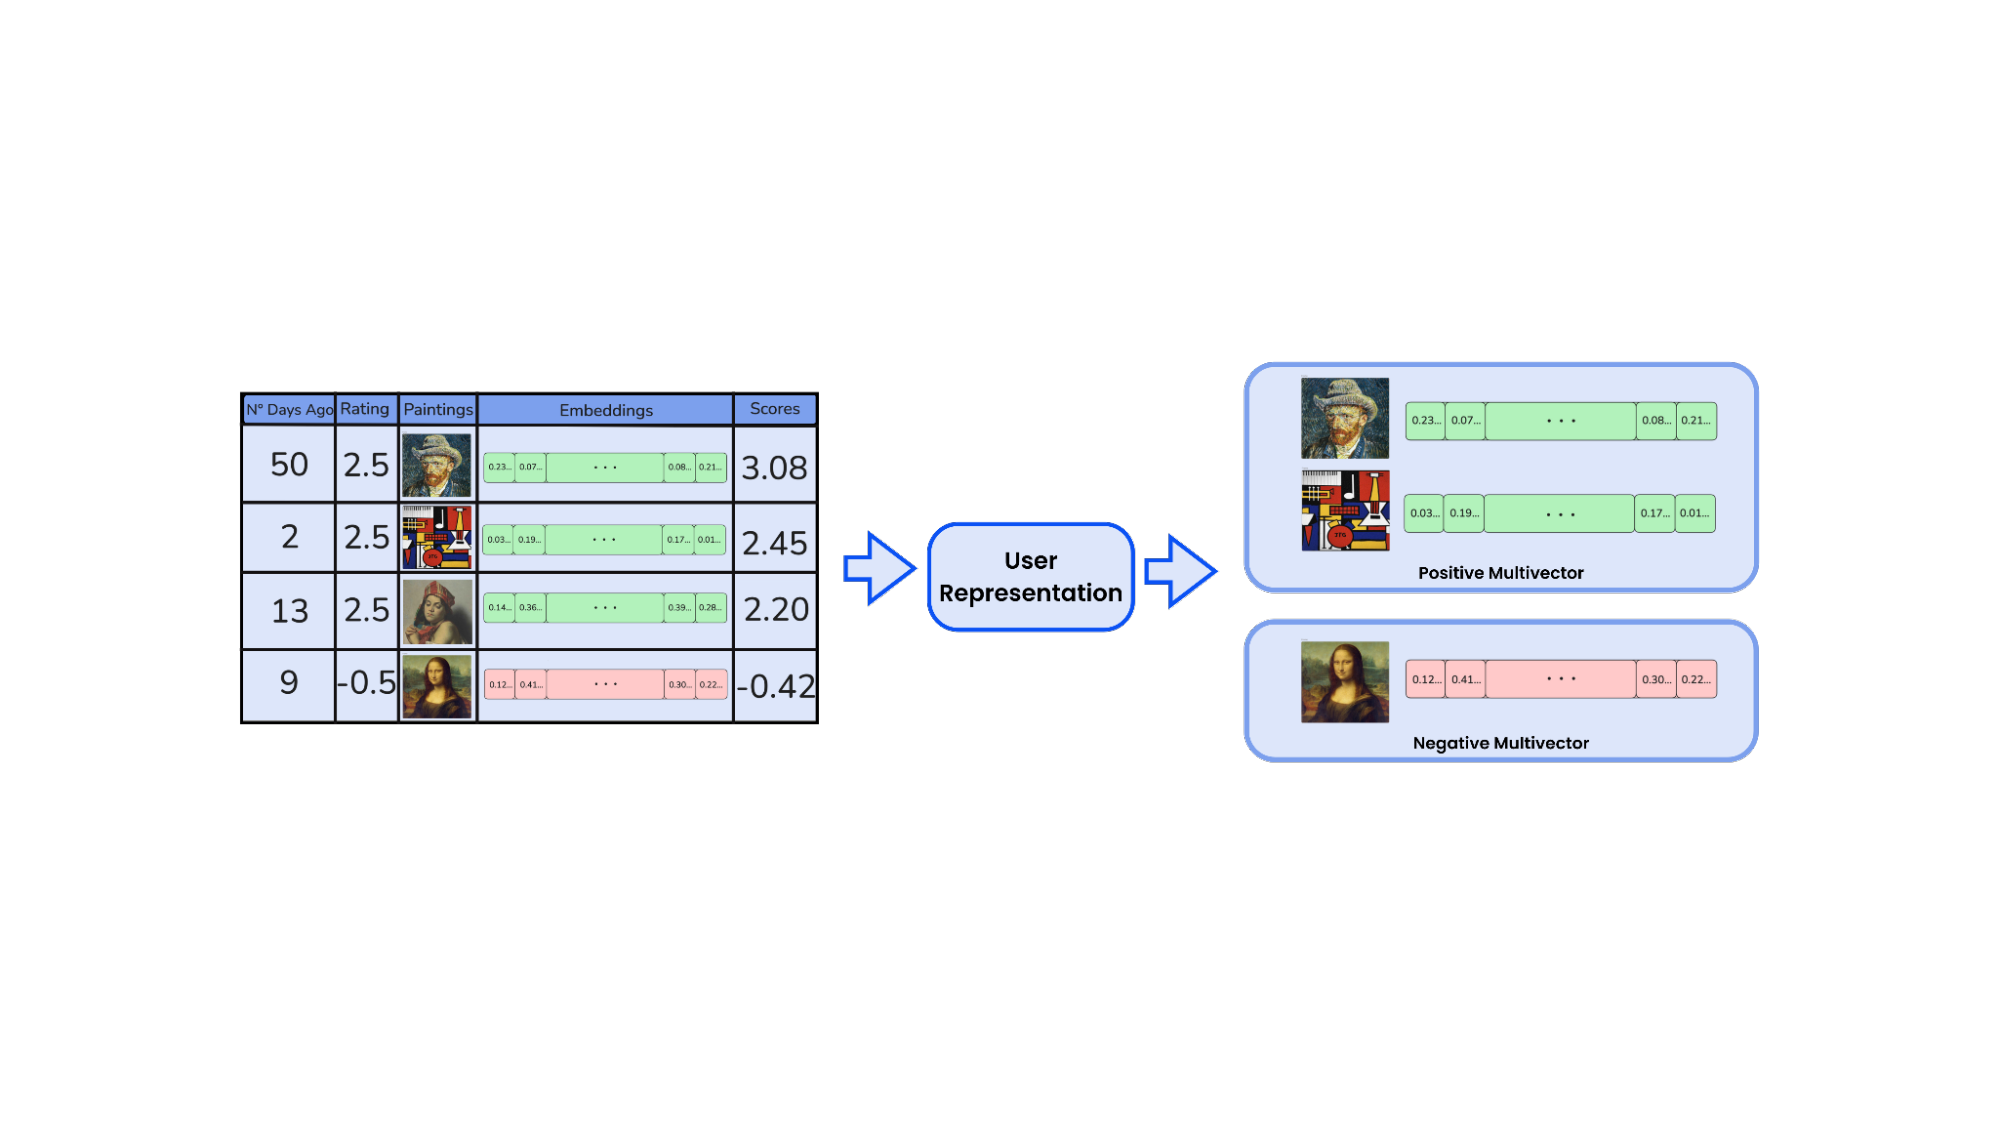
Retrieval via Qdrant’s Recommendation API
With each user represented by a set of positive and negative clusters condensed into multivectors, we can now move from modeling to discovery.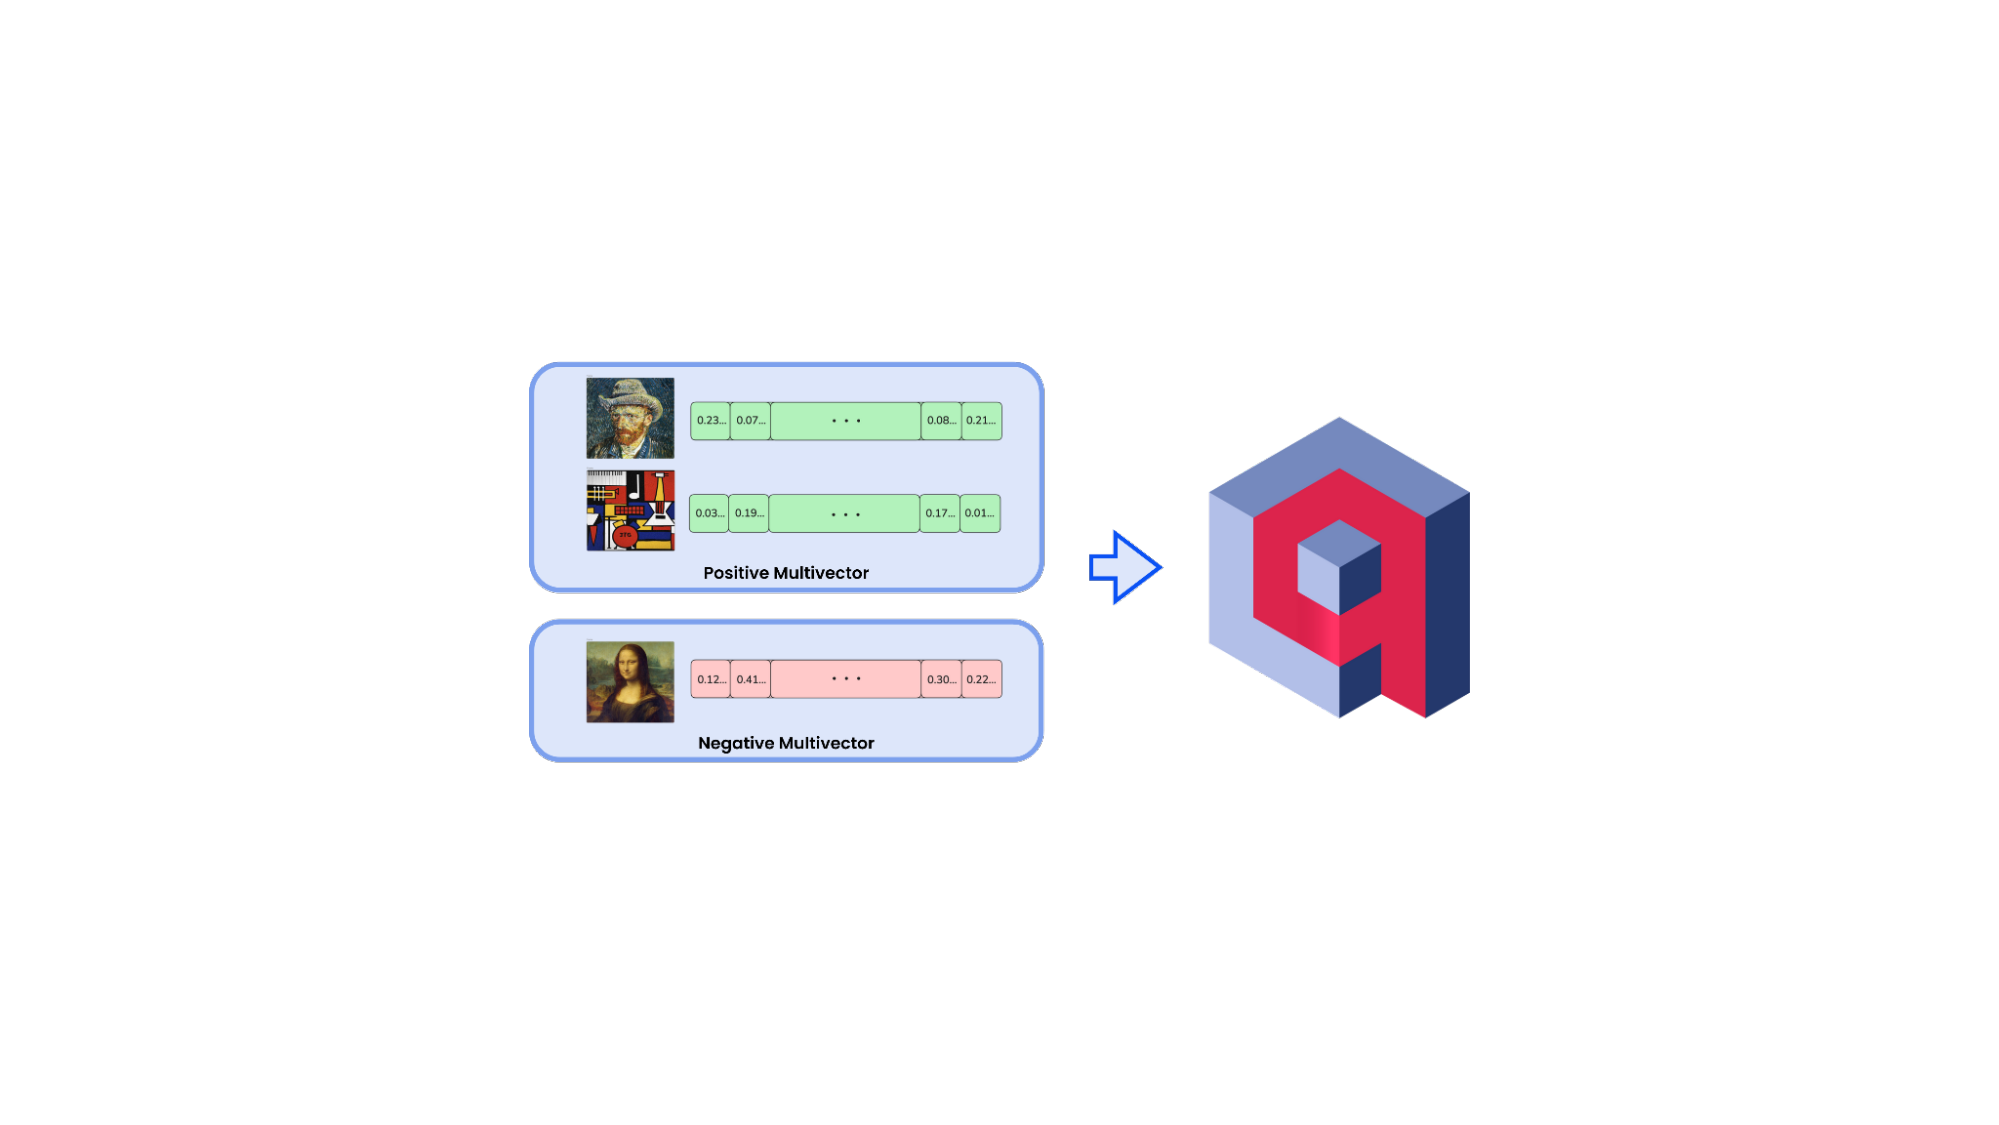
To recommend artists who might align with the users current aesthetic we turn to Qdrant Recommendation API. Unlike a standard vector search, this Qdrant’s functionality lets us provide both what we are looking for, represented by the positive multivector, and what we want to avoid, represented by the negative multivector.
The logic is simple: find artists whose positive taste profile strongly overlaps with the target user’s preferences, while minimizing similarity to the clusters they tend to reject.
To do this, we leverage Qdrant’s scoring strategy, a search method designed specifically for working with multiple vectors per point. This strategy evaluates each one individually. It computes the highest similarity to any positive cluster, and the strongest conflict to any negative one.
The final score for a candidate is computed as:
if best_positive_score > best_negative_score:
	score = best_positive_score
else:
	score = -(best_negative_score * best_negative_score)
This ensures that a candidate artist is only considered a match if they resonate with at least one of the user’s core preferences and don’t simultaneously resemble something the user tends to reject.
Additionally, we enforce constraints such as geographic location and age preferences by combining this vector logic with metadata filtering. For instance, we can restrict candidates to those from a specific region or within a certain age range using Qdrant’s payload filters.
This behavior makes intuitive sense for our use case. Two artists don’t need to be compatible across all aesthetic dimensions. A strong connection on just one, a shared sensibility in color, texture, or composition may be enough to suggest a meaningful alignment. The best score strategy respects that, it allows each cluster to speak for itself.
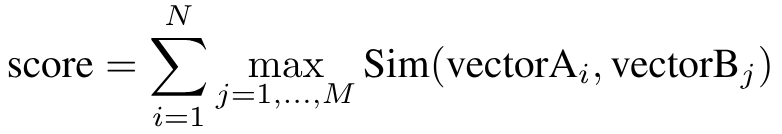
To compare multivectors themselves Qdrant uses the MaxSim function. This calculates the similarity between two multivectors by summing the maximum similarity between each vector in one matrix and the best-matching vector in the other:
Addressing the cold start problem
Every recommender hits a wall when it comes to new users or new items, what’s known as the cold start problem. Without interaction data, how do you know what to recommend?
Our answer is a friction-free onboarding process, in which we show a carefully curated mix of artworks that span diverse aesthetic themes. Each early interaction immediately feeds into their taste clusters. Within a handful of interactions, the system already sees a rough silhouette of their style and can start returning genuinely relevant recommendations, no long warm-up, no guesswork.
Final Thoughts
In this walkthrough we moved from raw interaction logs to a living recommender:
- Built a dynamic user profile that captures both attraction and aversion.
- Used an encoder to drop every piece of content into the same vector space.
- Clustered those vectors with HDBSCAN, chose medoids as anchors, and let an exponential decay function show which clusters are more relevant.
- Queried Qdrant’s Recommendation API to retrieve candidates that closely align with the user’s positive multivector, while actively distancing those associated with negative incompatibility signals.
That’s the entire stack in one breath and it’s all you need to ship a production-ready recommendation engine that can be applied across domains!
