


Qdrant 1.18 - TurboQuant
Abdon Pijpelink
·May 11, 2026

On this page:
Qdrant 1.18.0 is out! Let’s look at the main features for this version:
TurboQuant: A new quantization method that, at twice the compression ratio of scalar quantization, delivers similar recall and speed.
Memory Monitoring: Inspect a collection’s disk, RAM, and page cache usage broken down by component (vectors, payload, indexes, and more) via a new Web UI view and API endpoint.
Adding and Removing Named Vectors: Add or remove named vectors to an existing collection’s schema without having to recreate it.
Additionally, version 1.18 adds two improvements to audit logging: a new API endpoint to query audit logs, and support for request tracing IDs. It also introduces per-collection API metrics and two new strict mode guardrails.
TurboQuant

Quantization is a technique that reduces the memory footprint of a vector collection by compressing floating-point values to a lower bit depth. Smaller vectors fit more readily in memory, which speeds up search and lowers infrastructure costs.
Choosing a quantization method means accepting tradeoffs. Binary quantization is fast but requires a centered vector distribution, and accuracy degrades significantly for smaller vectors. Scalar quantization is reliable but compresses only by a factor of four. Product quantization compresses more aggressively, but at the cost of accuracy and speed.
Version 1.18 introduces support for TurboQuant, a new quantization method developed by Google Research. TurboQuant applies a fast Hadamard rotation to vectors before compression, which redistributes values evenly across coordinates. Because this rotation normalizes the data distribution, TurboQuant works well with any embedding model.
Qdrant’s implementation of TurboQuant extends the original algorithm to close the gap between the algorithm’s theoretical assumptions and real-world embeddings. A length renormalization step corrects a recall-degrading bias caused by quantization error, an idea borrowed from RaBitQ. A per-coordinate calibration pre-pass fits the data to precomputed codebooks, aiming to recover accuracy lost to distribution mismatch. Cosine, dot product, and L2 are all supported as first-class distance metrics. And finally, we implemented highly optimized SIMD acceleration for TurboQuant to achieve maximum performance.
How TurboQuant Compares
TurboQuant vs Scalar Quantization
The following table shows recall for 4-bit TurboQuant (TQ4) compared to uncompressed vectors (F32) and scalar quantization (SQ) across four benchmarked datasets. Benchmarks were run with HNSW configured with m=16 and ef_construct=128.
| Dataset | F32 | SQ | TQ4 |
|---|---|---|---|
| arxiv-titles-instructorxl-embeddings | 0.9419 | 0.9285 | 0.9193 |
| gte-multilingual-ads-1M | 0.9298 | 0.9187 | 0.9169 |
| dbpedia-entities-openai3-text-embedding-3-large-1536-100K | 0.9348 | 0.9339 | 0.9271 |
| wikipedia-2023-11-embed-multilingual-v3 | 0.9446 | 0.9014 | 0.9261 |
Compared to scalar quantization, TurboQuant delivers similar recall at double the compression ratio. Results vary by dataset and embedding model: TurboQuant may slightly outperform or underperform scalar quantization.
TurboQuant vs Binary Quantization
The following table shows recall for 1-bit TurboQuant (TQ1) compared to uncompressed vectors (F32) and 1-bit binary quantization (BQ1) across four benchmarked datasets. Benchmarks were run with HNSW configured with m=16 and ef_construct=128.
| Dataset | F32 | BQ1 | TQ1 |
|---|---|---|---|
| arxiv-titles-instructorxl-embeddings | 0.9419 | 0.4683 | 0.6763 |
| gte-multilingual-ads-1M | 0.9298 | 0.6760 | 0.7717 |
| dbpedia-entities-openai3-text-embedding-3-large-1536-100K | 0.9348 | 0.6921 | 0.7924 |
| wikipedia-2023-11-embed-multilingual-v3 | 0.9446 | 0.5409 | 0.6300 |
Compared to 1-bit binary quantization, 1-bit TurboQuant offers better recall at equivalent storage budgets, albeit at a lower speed. Similar trends are observed for 1.5-bit and 2-bit configurations.
We will soon publish an article with detailed numbers, including throughput and indexing times.
Get Started with TurboQuant
In our benchmarks, TurboQuant, at twice the compression ratio of scalar quantization, delivers similar recall and speed. Results vary by dataset and embedding model: it may outperform or slightly underperform scalar quantization. This makes TurboQuant a good default choice for many use cases.
Compared to binary quantization, TurboQuant offers better recall at lower speed and equivalent storage budgets.
Benchmark which quantization method performs best on your data and embedding model, and choose the one that fits your needs. To get started with TurboQuant, refer to the documentation.
Memory Monitoring

Understanding how much memory a Qdrant collection actually uses has traditionally required cross-referencing OS-level tools, Prometheus gauges, and rough estimates based on collection configuration. There was no straightforward way to see which component (vectors, payload, indexes) was consuming memory, making capacity planning and diagnosing memory pressure difficult.
This release introduces collection memory monitoring, offering a detailed breakdown of disk, RAM, and OS page cache usage per component, summed across the whole cluster.
In Web UI, open the collection detail page and select the Memory tab to see the memory breakdown.
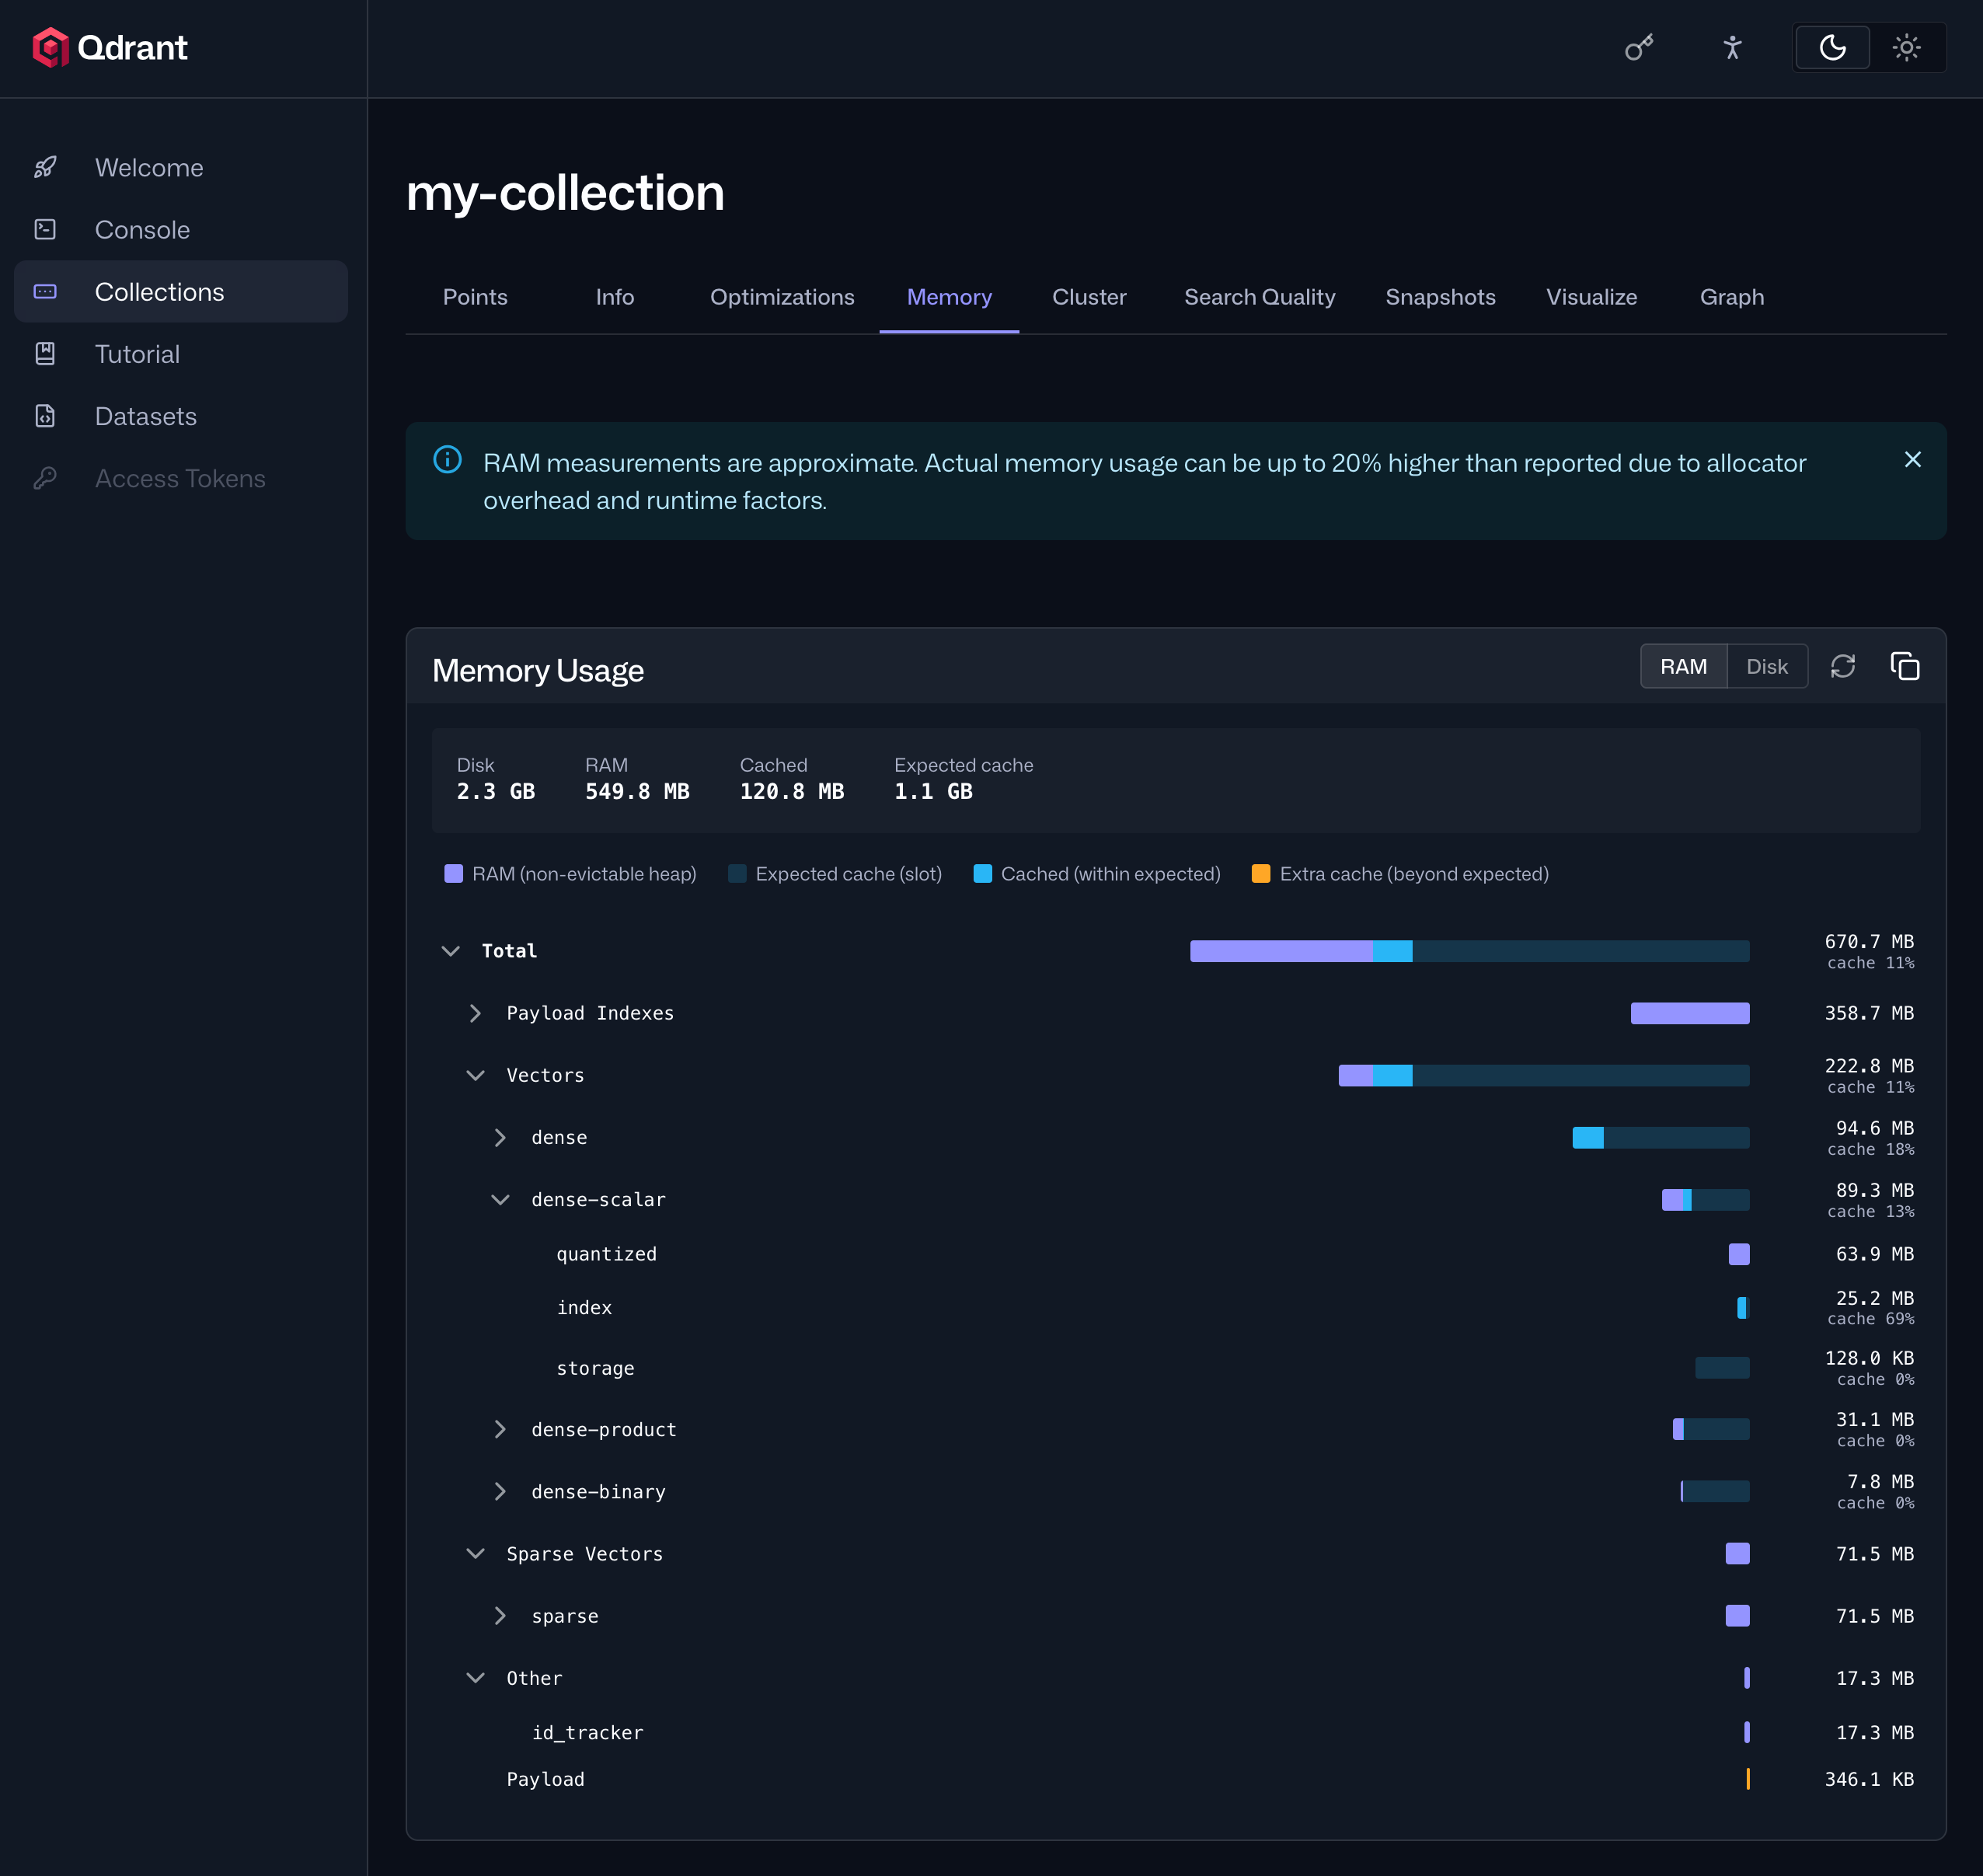
The same data is available through Qdrant’s API.
Adding and Removing Named Vectors

When a collection’s vector schema needed to change, for example, when adding support for a new embedding model or retiring an old one, there was no way to update it in place. The only option was to recreate the collection from scratch and re-ingest all points.
Version 1.18 makes it possible to add and remove named vectors to an existing collection’s schema without having to recreate it. This makes embedding model migration considerably easier. You can now add a new vector field, populate it in the background, and remove the old one when you’re ready.
Audit Logging Improvements

Audit logging was introduced in Qdrant 1.17 to track API operations. Version 1.18 adds two improvements: a new API endpoint to query audit logs, and support for attaching tracing IDs to requests.
Query Audit Logs
Audit logs were previously only accessible as files on disk, which meant reviewing them required direct server access. There was no way to easily search, filter, or aggregate log entries, making security reviews and compliance audits labor-intensive.
Version 1.18 introduces a new query audit logs API endpoint. It returns log entries aggregated across all nodes in a cluster, with each entry covering the timestamp, API method, authentication type, access result, and client details. You can filter results by time range or by any field value.
Request Tracing IDs
When an audit log entry records a denied request or an unexpected operation, it can be hard to link that entry back to the client-side request that triggered it, making incident response and debugging harder than it needs to be.
This release adds support for request tracing IDs. Attach a tracing ID to any request by passing it in the x-request-id, x-tracing-id, or traceparent header. Qdrant records the tracing ID in the corresponding audit log entry, enabling you to correlate client-side and server-side logs.
Per-Collection API Metrics

Qdrant’s /metrics endpoint exposes REST and gRPC response metrics, but they were aggregated across all collections. When response times spiked or error rates climbed, there was no easy way to identify which collection was responsible.
A community contribution to version 1.18 adds a ?per_collection=true parameter to the /metrics endpoint. When set, the rest_responses_* and grpc_responses_* metrics include a collection label, giving you a per-collection breakdown of request counts, failure counts, and response durations.
New Strict Mode Guardrails

Strict mode lets administrators set guardrails to prevent inefficient API requests from overloading your system. Version 1.18 adds two new guardrails to strict mode:
max_resident_memory_percent: Rejects memory-consuming write operations when the process’s resident memory exceeds the specified percentage of total system memory. This protects against out-of-memory situations under sustained data ingestion.
search_max_batchsize: Caps the number of queries allowed in a single batch search request, preventing oversized batches from degrading other workloads running on the same node.
Full Change Log

For a full list of all changes in version 1.18, refer to the change log.
Upgrading to Version 1.18

On Qdrant Cloud, navigate to the Cluster Details screen and select Version 1.18 from the dropdown menu. The upgrade process may take a few moments.
We recommend upgrading versions one by one. On Qdrant Cloud, this is done automatically when you select the target version. If you’re self-hosting, upgrade to the latest patch version of each intermediate minor version first, for example 1.16.x→1.17.x→1.18.0.
Engage

We would love to hear your thoughts on this release. If you have any questions or feedback, join our Discord or create an issue on GitHub.
