Monitor Collection Memory Usage
Available as of v1.18.0
Qdrant lets you inspect a collection’s disk space, RAM, and OS page cache usage, summed up across the whole cluster and broken down by component. Use this to plan capacity, diagnose memory pressure, or understand which parts of a collection are resident in memory.
This information is available in the Qdrant Web UI and through the API.
Web UI
Open the collection detail page and select the Memory tab. It shows the memory breakdown for the collection, updated on demand.
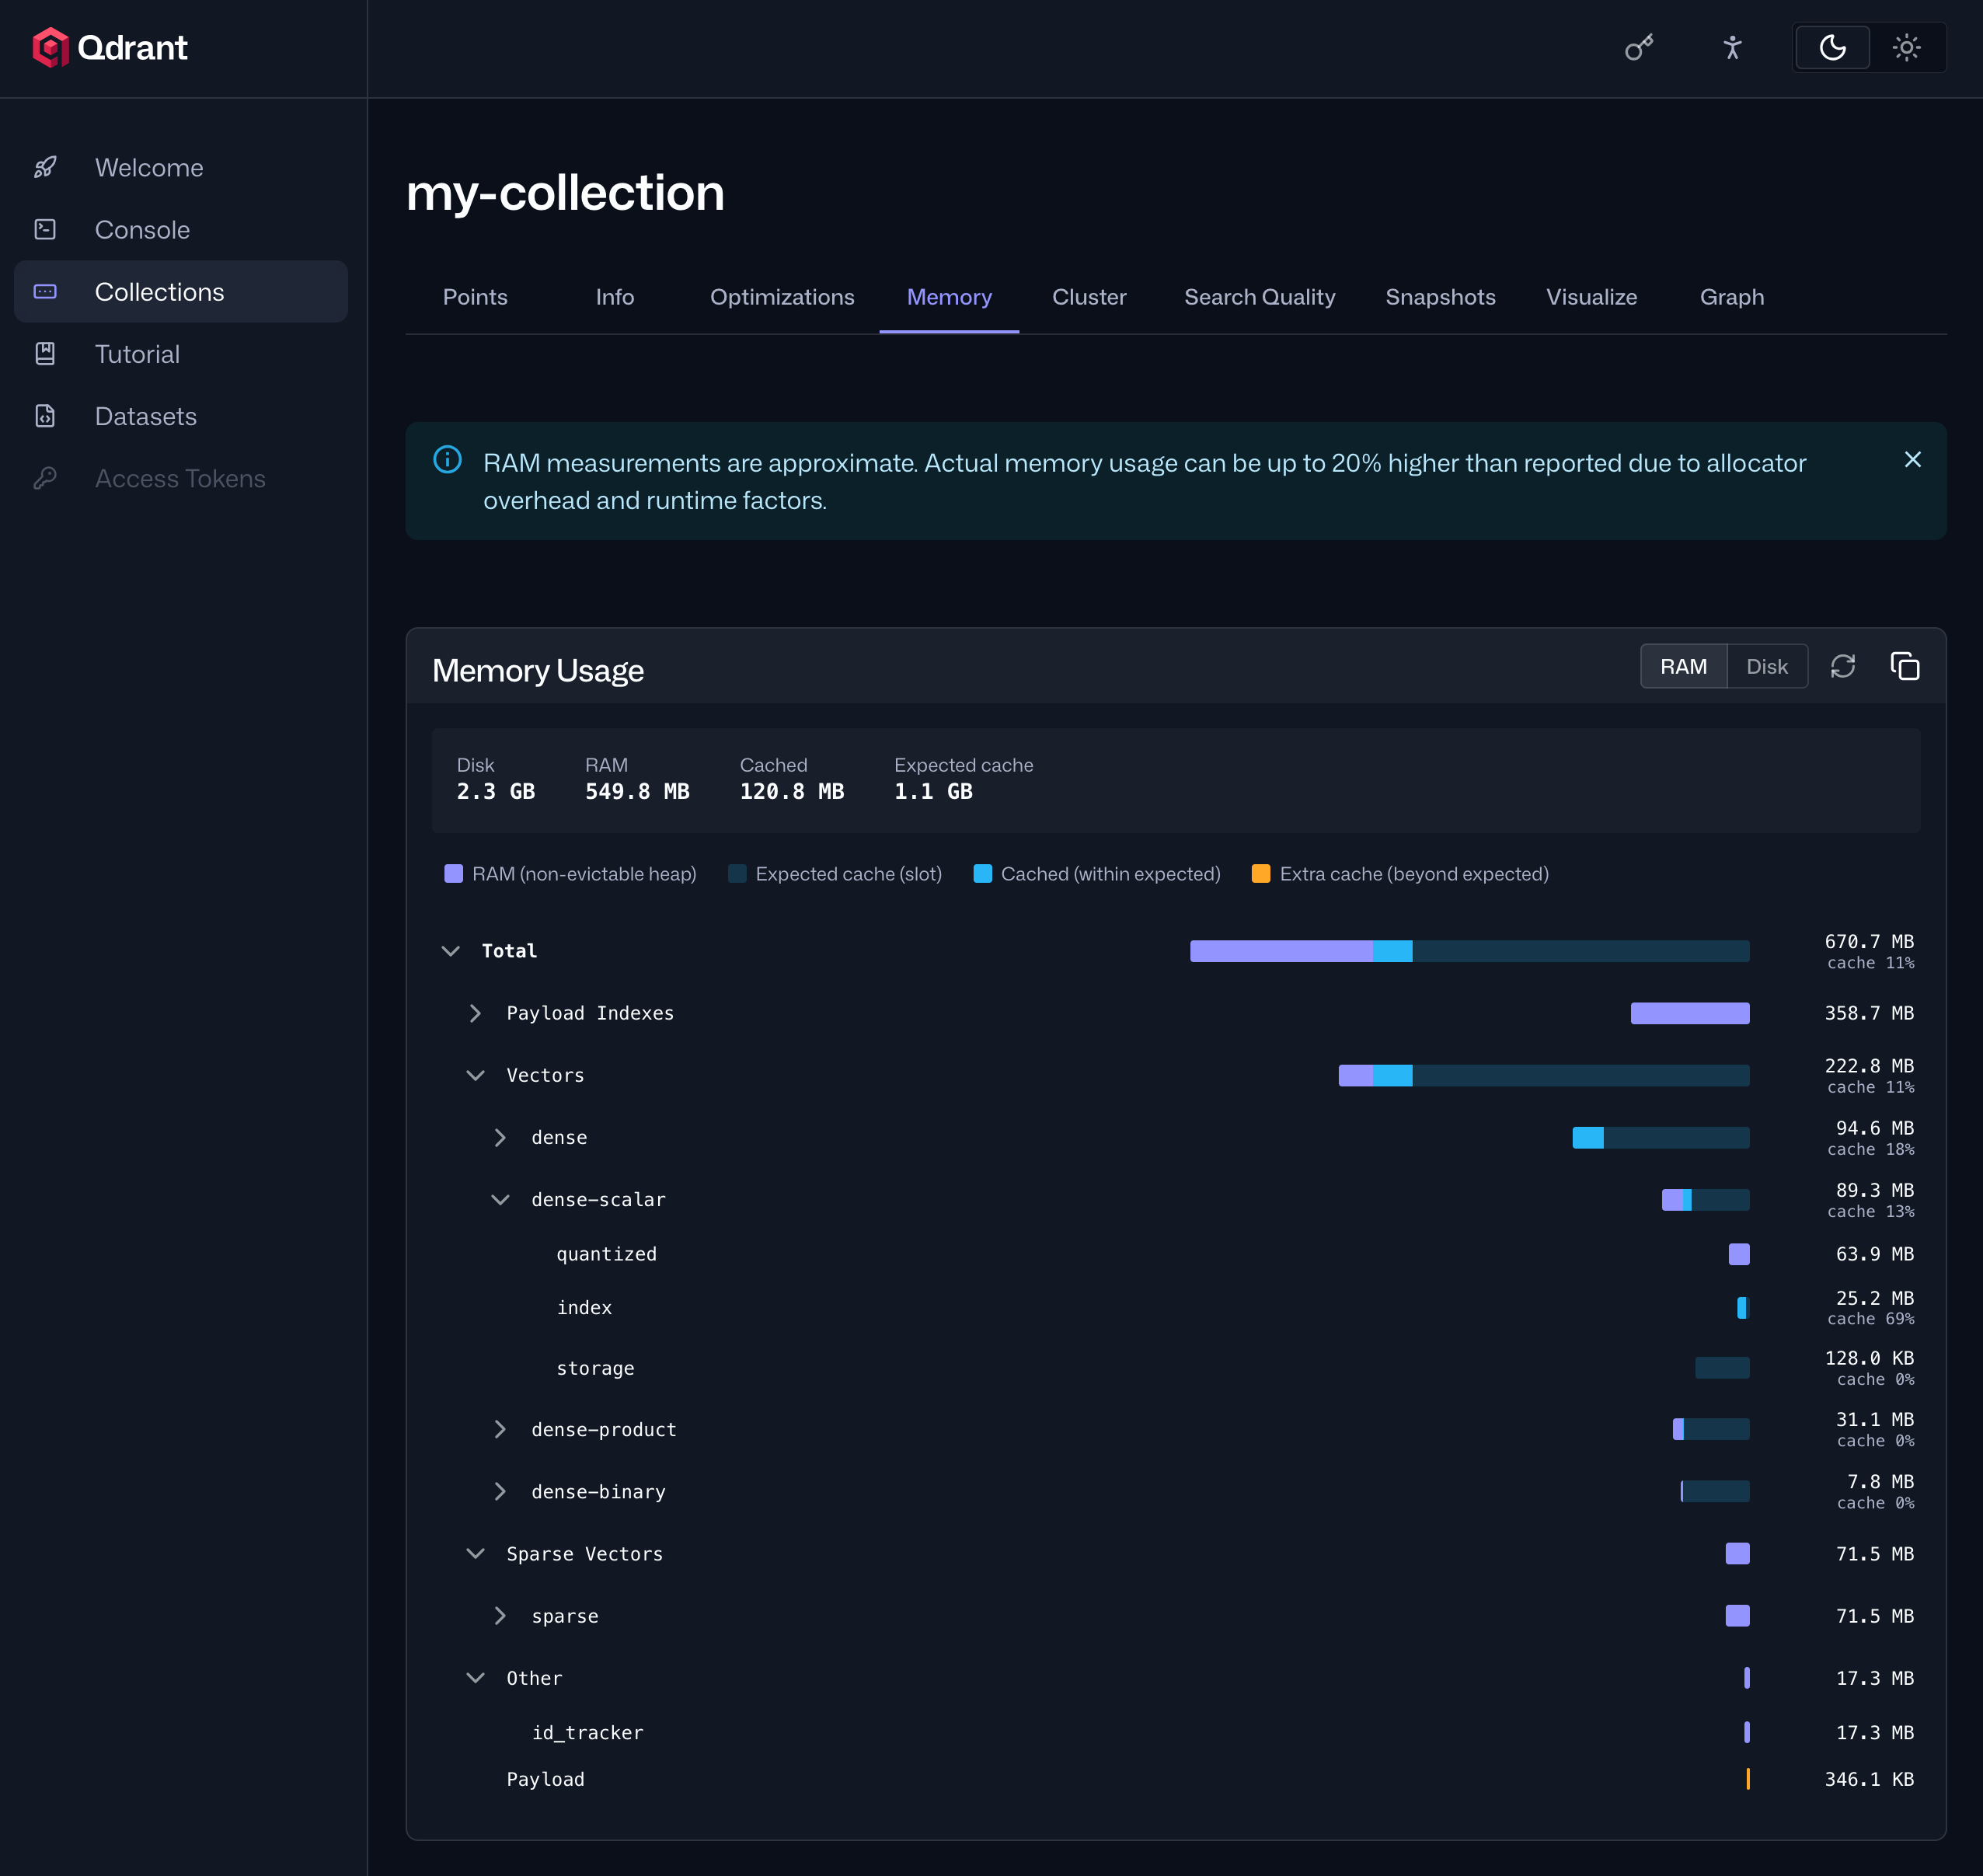
Understanding the Fields
The breakdown covers these components:
| Component | Description |
|---|---|
| Total | Aggregate across all components. |
| Vectors | Per dense and multi-dense vector: storage, index, and optionally quantization. |
| Sparse Vectors | Per sparse vector: storage and index. |
| Payload | Payload storage. |
| Payload Index | Per payload field index. |
| ID Tracker | Maps external point IDs to internal ones. |
Each component reports four values:
| Field | Description |
|---|---|
| Disk | Total file sizes on disk. |
| RAM | Non-evictable heap RAM: in-memory data structures not backed by memory-mapped files. |
| Cached | Evictable RAM: file pages currently resident in the OS page cache. |
| Expected Cache | The amount of data that should ideally be cached for best performance. Compare this against Cached to see how much of the working set is warm. |
API
You can retrieve the same data though Qdrant’s API:
curl http://localhost:6333/collections/{collection_name}/memory
Accuracy
The reported values are estimates. RAM usage is typically underestimated by 10–15% because memory allocated by third-party libraries and the allocator itself isn’t accounted for.
On non-Unix systems, Cached is always reported as 0.