Configuring Logging & Monitoring in Qdrant Private Cloud
Logging
You can access the logs with kubectl or the Kubernetes log management tool of your choice. For example:
kubectl -n qdrant-private-cloud logs -l app=qdrant,cluster-id=a7d8d973-0cc5-42de-8d7b-c29d14d24840
Configuring log levels: You can configure log levels for the databases individually through the QdrantCluster spec. Example:
apiVersion: qdrant.io/v1
kind: QdrantCluster
metadata:
  name: qdrant-a7d8d973-0cc5-42de-8d7b-c29d14d24840
  labels:
    cluster-id: "a7d8d973-0cc5-42de-8d7b-c29d14d24840"
    customer-id: "acme-industries"
spec:
  id: "a7d8d973-0cc5-42de-8d7b-c29d14d24840"
  version: "v1.11.3"
  size: 1
  resources:
    cpu: 100m
    memory: "1Gi"
    storage: "2Gi"
  config:
    log_level: "DEBUG"
Integrating with a log management system
You can integrate the logs into any log management system that supports Kubernetes. There are no Qdrant specific configurations necessary. Just configure the agents of your system to collect the logs from all Pods in the Qdrant namespace.
Monitoring
The Qdrant Cloud console gives you access to basic metrics about CPU, memory and disk usage of your Qdrant clusters.
If you want to integrate Qdrant metrics into your own monitoring system, configure it to scrape the following endpoints, which provide metrics in a Prometheus/OpenMetrics-compatible format:
/metricson port 6333 of every Qdrant database Pod. This provides metrics about each database and its internals./metricson port 9290 of the Qdrant Operator Pod. This provides metrics about the Operator, as well as the status of Qdrant clusters and snapshots.- For metrics about the state of Kubernetes resources like Pods and PersistentVolumes within the Qdrant Hybrid Cloud namespace, we recommend using kube-state-metrics
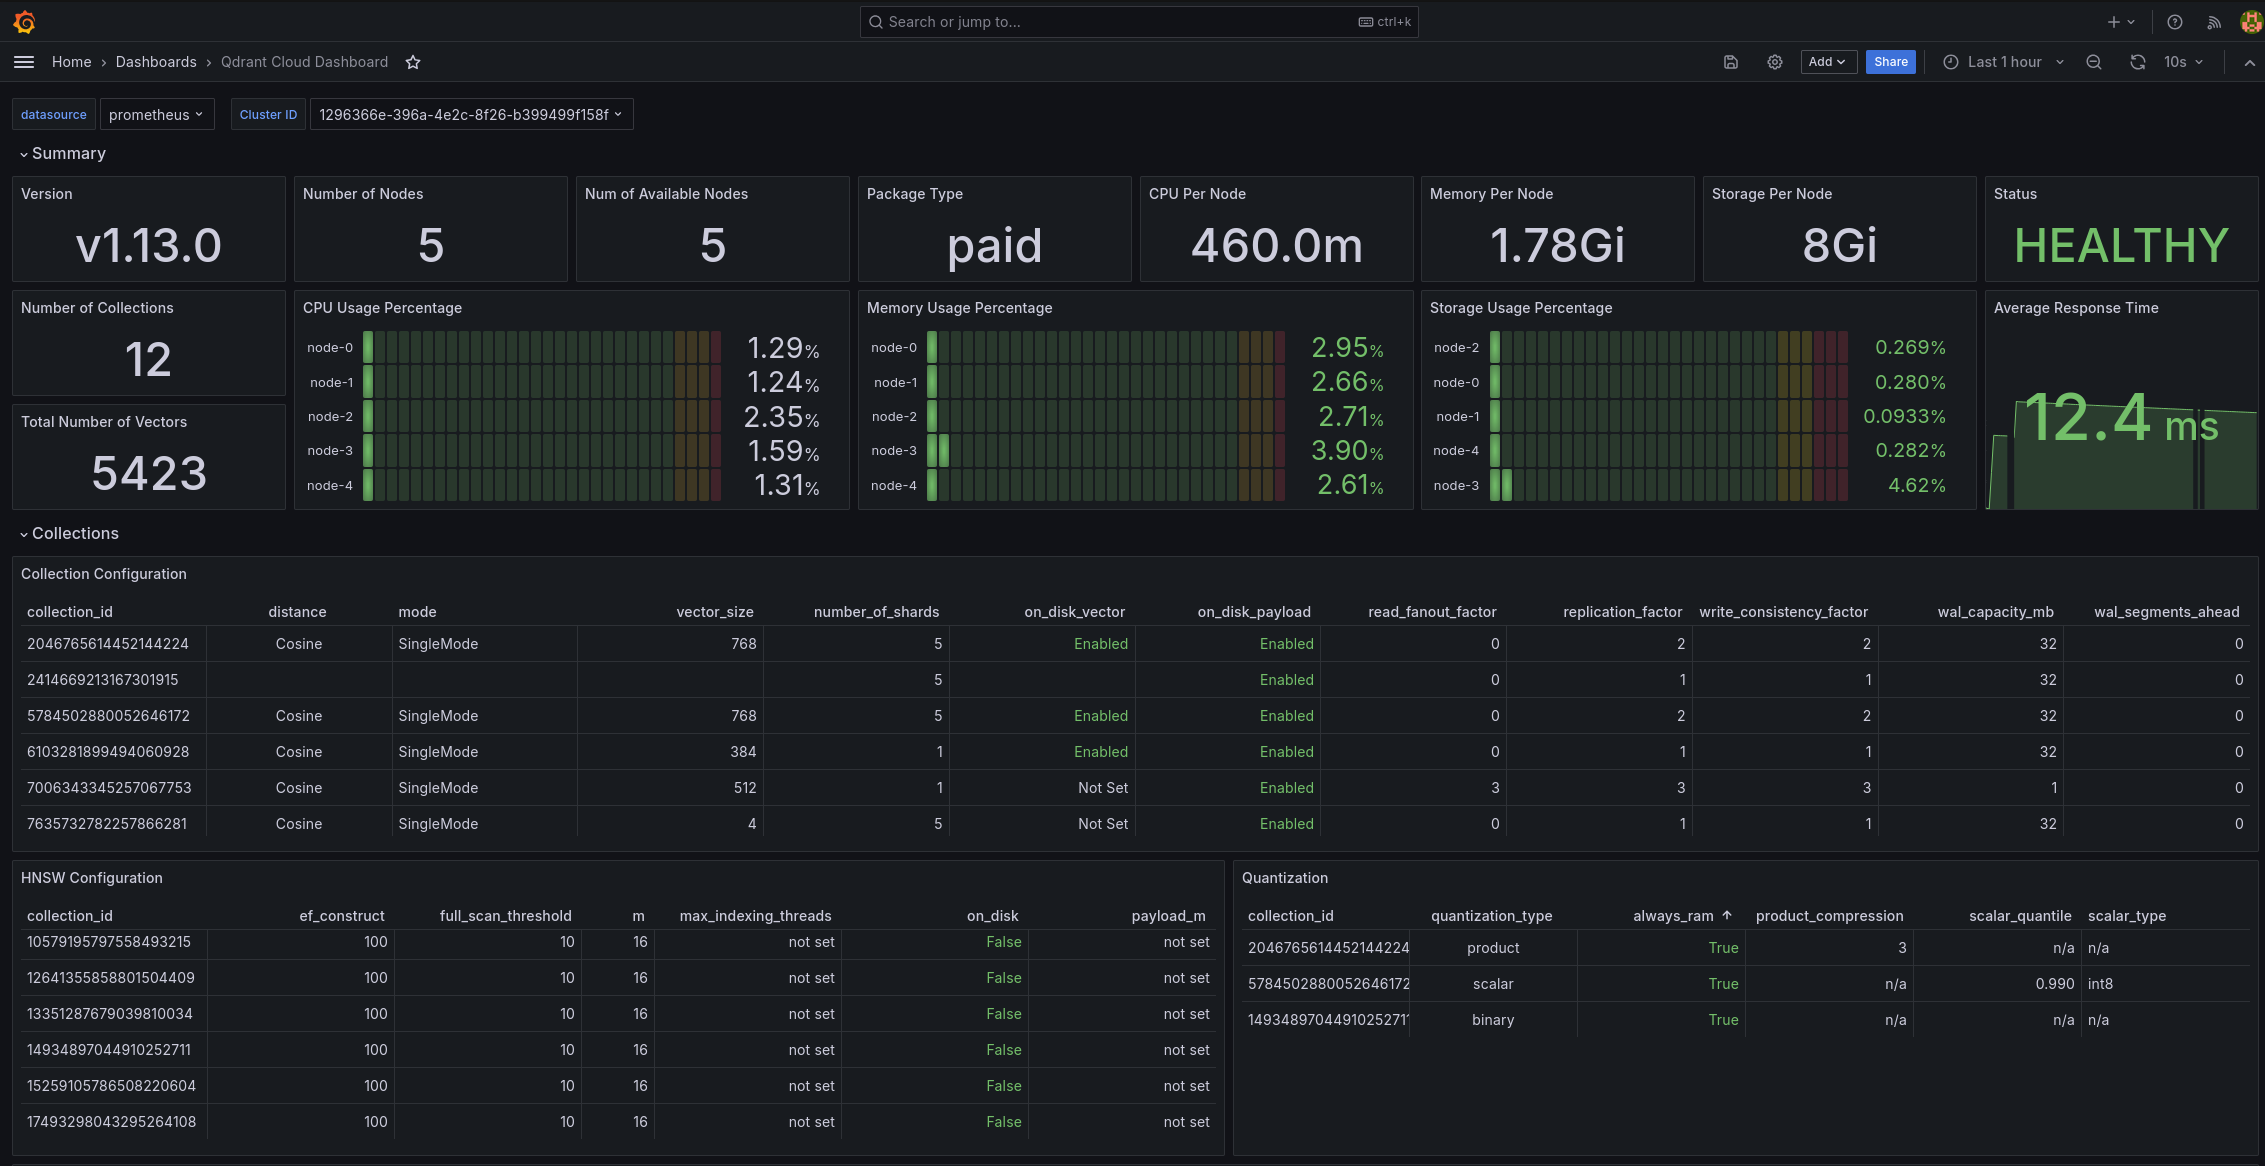
Grafana dashboard
If you scrape the above metrics into your own monitoring system, and you are using Grafana, you can use our Grafana dashboard to visualize these metrics.