Monitoring Qdrant Cloud Clusters
Telemetry
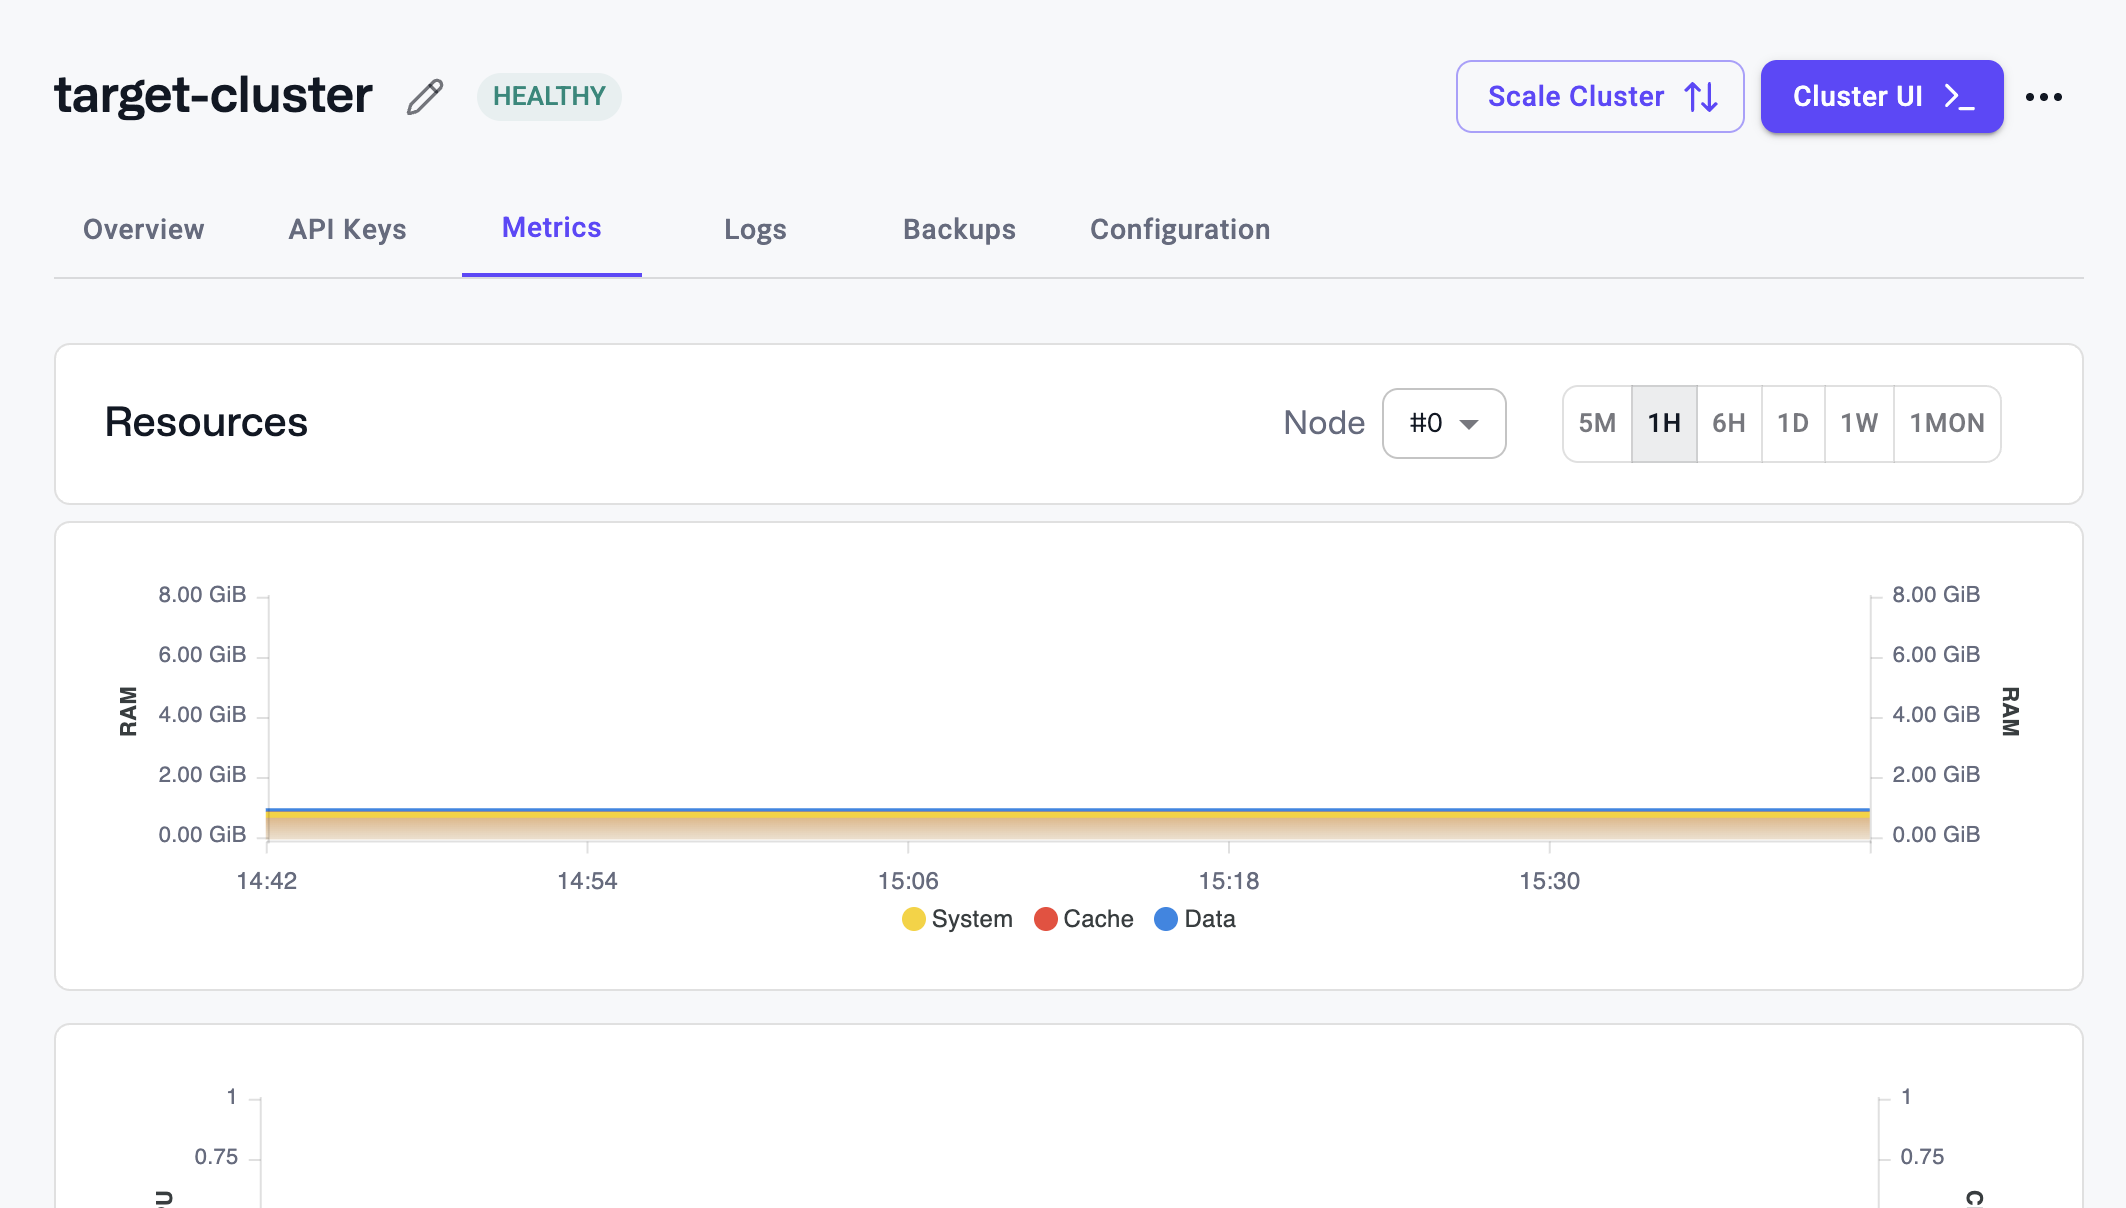
Qdrant Cloud provides you with a set of metrics to monitor the health of your database cluster. You can access these metrics in the Qdrant Cloud Console in the Metrics and Request sections of the Cluster Details page.
Logs
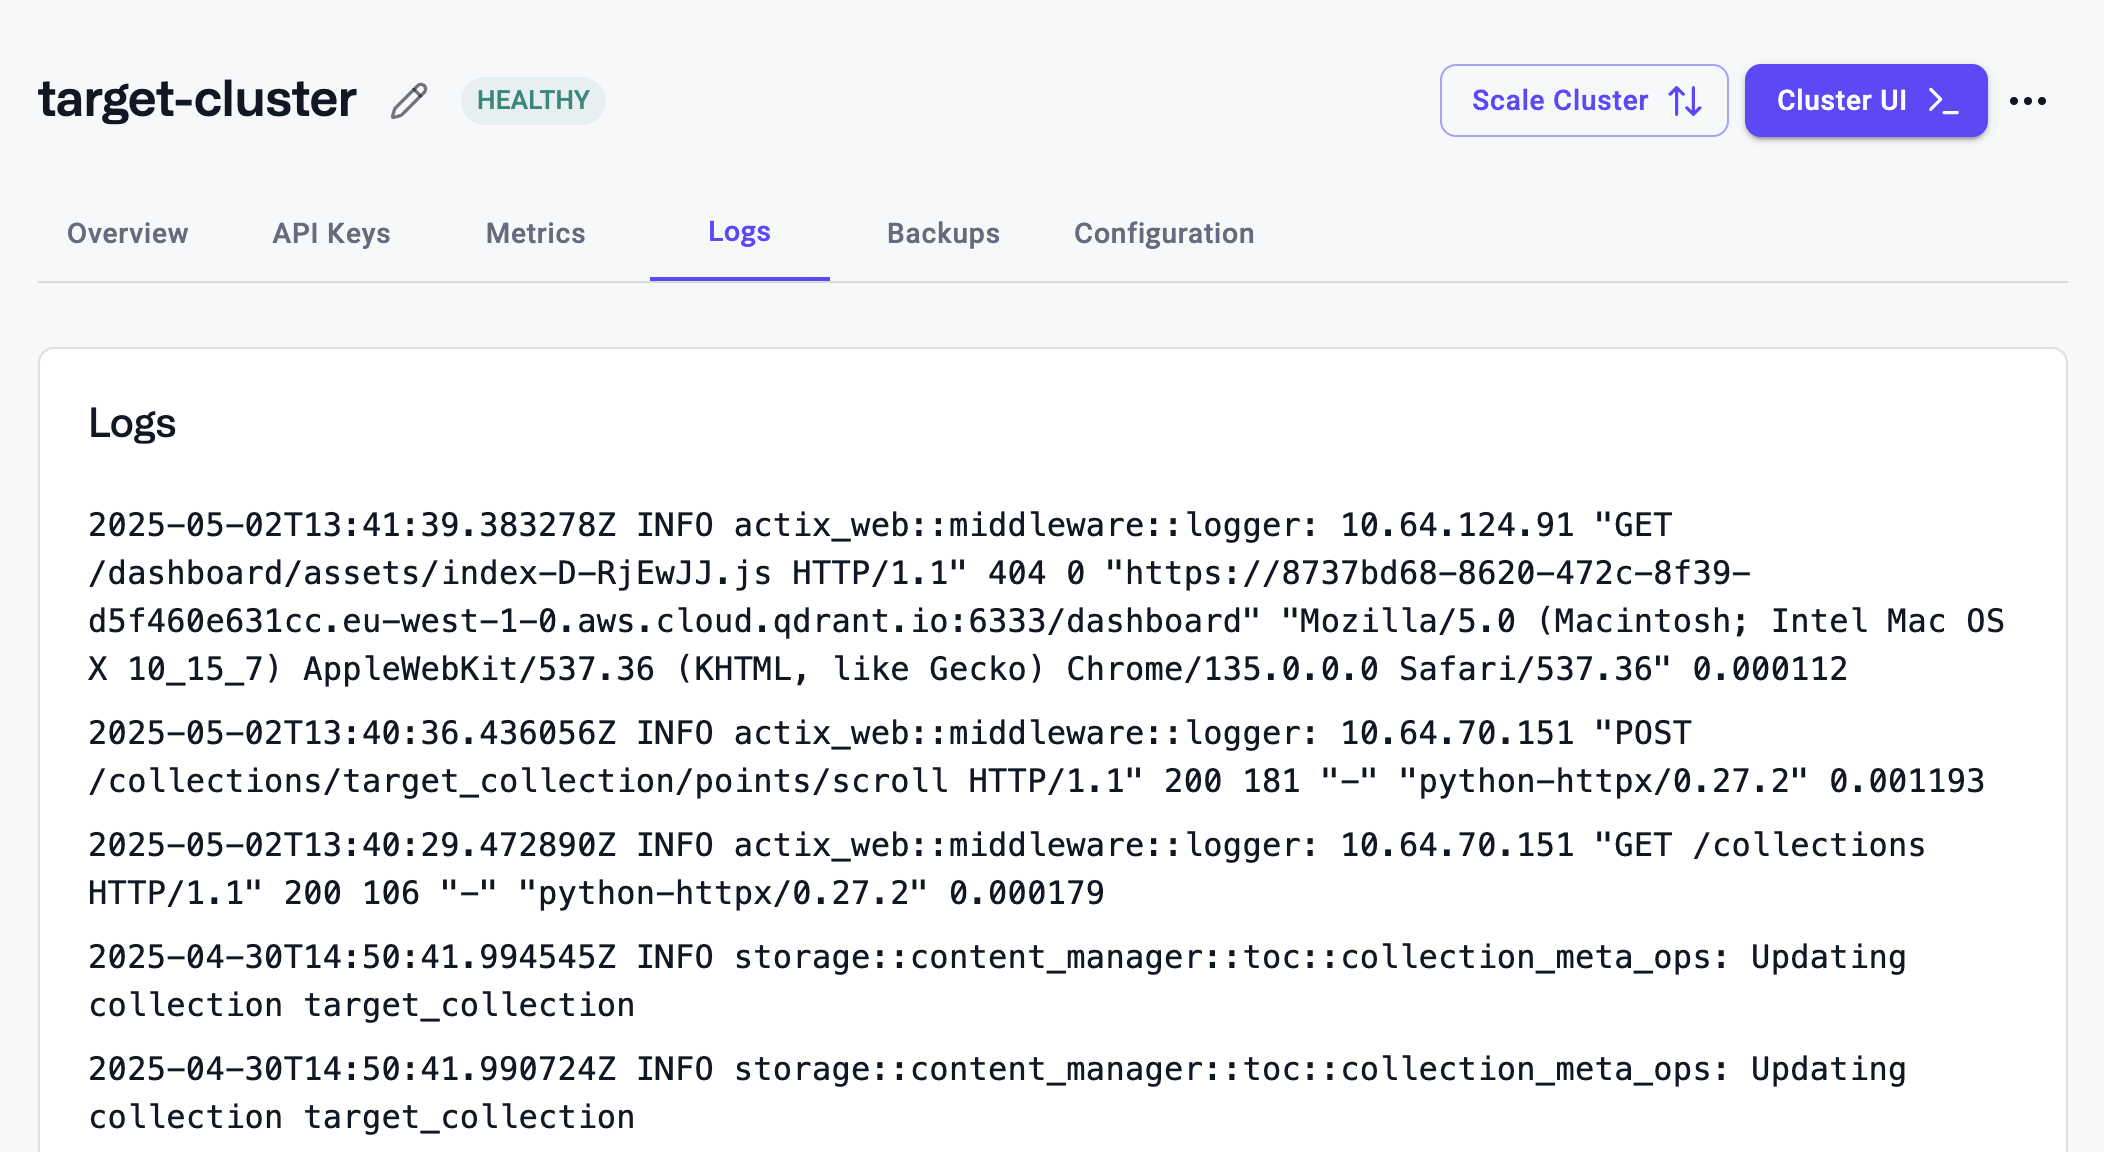
Logs of the database cluster are available in the Qdrant Cloud Console in the Logs section of the Cluster Details page.
Alerts
The account owner will receive automatic alerts via email if your cluster has any of the following issues:
Memory Overutilized
Why am I getting this alert?
Your cluster is using more than 80% of its memory allocation for over 5 minutes.
What does this mean for me?
If your usage continues to grow beyond the allocation then your cluster will fail due to resource pressure, and you will see disruption.
What can I do to resolve this?
You have the option to scale vertically to increase existing node capacity, or horizontally to spread the load more evenly, increase capacity, and reduce overall pressure.
Alternatively, you can delete data from your cluster to reduce the amount of resources required.
Where can I learn more about this alert?
You can learn about high-availability and production readiness here.
You can learn about vertical scaling here.
You can learn about horizontal scaling here.
Disk Space Overutilized
Why am I getting this alert?
Your cluster is using more than 80% of its disk space allocation for over 5 minutes.
What does this mean for me?
If your usage continues to grow beyond the allocation then your cluster will fail due to resource pressure, and you will see disruption.
What can I do to resolve this?
You have the option to scale vertically to increase existing node capacity, or horizontally to spread the load more evenly, increase capacity, and reduce overall pressure.
Alternatively, you can delete data from your cluster to reduce the amount of resources required.
Where can I learn more about this alert?
You can learn about high-availability and production readiness here.
You can learn about vertical scaling here.
You can learn about horizontal scaling here.
A Node Ran Out of Memory
Why am I getting this alert?
Nodes in your cluster ran out of RAM.
What does this mean for me?
One or more Qdrant nodes tried to allocate more RAM than available while storing data or serving requests, which resulted in the operating system stopping the Qdrant process.
If your cluster is highly available you may avoid total downtime but the situation is still unstable. Without high availability you should expect disruption until your cluster has been scaled up.
What can I do to resolve this?
Ensuring your cluster is highly available will mitigate the worst case scenario, but there is still significant operational risk if untreated.
You have the option to scale vertically to increase existing node capacity, or horizontally to spread the load more evenly and reduce overall pressure.
Alternatively, you can delete data from your cluster to reduce the amount of RAM required.
Where can I learn more about this alert?
You can learn about high-availability and production readiness here.
You can learn about vertical scaling here.
You can learn about horizontal scaling here.
A Node Ran Out of Disk Space
Why am I getting this alert?
One or more nodes in the cluster have run out of disk.
What does this mean for me?
Nodes that run out of disk will be unable to store new vectors.
This can lead to disruption if not resolved.
What can I do to resolve this?
Scaling vertically to increase disk space on existing nodes.
Scaling horizontally by adding new nodes so that shards are spread out more. Re-sharding may be necessary if there are not enough shards to distribute to new nodes.
Alternatively, you can delete data from your cluster to reduce the amount of disk required.
Where can I learn more about this alert?
You can learn more about disk capacity here.
You can learn about vertical scaling here.
You can learn about horizontal scaling here.
You can learn about re-sharding here.
Cluster Has Too Many Collections
Why am I getting this alert?
Your cluster has >500 collections, suggesting an anti-pattern for Qdrant.
What does this mean for me?
A large amount of collections brings significant resource overhead. If not addressed this will degrade resilience and even cause outages in the long term.
What can I do to resolve this?
A single collection with payload index partitioning is usually optimal compared to many small individual tenant collections.*
It is also possible to split collections across clusters, the Qdrant Migration CLI can help you with this.
Where can I learn more about this alert?
You can learn more about how to set up multi-tenancy with a Qdrant collection here.
Cluster is Unhealthy
Why am I getting this alert?
Your cluster’s nodes have been marked as unhealthy for over 5 minutes.
What does this mean for me?
One or more nodes in your Qdrant Cluster has been unhealthy for longer than 5 mins indicating there is a serious issue that needs attention.
What can I do to resolve this?
There are many reasons for a cluster’s workloads to become unhealthy. We send proactive alerts for common scenarios and recommend checking for other alerts. It is also important to validate any available monitoring statistics for both Qdrant and your application.
We recommend checking any recent changes to client code, or configuration in your environment, looking for increases in search or write requests, to ensure no recent changes are the cause.
Cluster Version is Not Covered by SLA
Why am I getting this alert?
Qdrant Cloud only supports the latest and previous 3 minor versions of Qdrant.
What does this mean for me?
Support requests against your cluster will not be covered by the SLA.
What can I do to resolve this?
You can upgrade your cluster version by visiting the cluster details page.
Where can I learn more about this alert?
Learn more about updating your cluster here
Learn more about the Qdrant SLA and version policy here
Database API Key is About to Expire
Why am I getting this alert?
A Database Key is expiring soon.
What does this mean for me?
Requests using an expired key won’t be successful, which could lead to failed queries and application failures.
What can I do to resolve this?
If you are still using the key, you can create a new Database API Key and update your application to use the new one.
Where can I learn more about this alert?
Learn about the SDKs here.
Learn more about JWT Keys and permissions here.
A Node is CPU Throttled
Why am I getting this alert?
One or more cluster workloads have been CPU throttled for over 5 mins.
What does this mean for me?
CPU usage is constantly saturated which forces the operating system to throttle your Qdrant database nodes. This means that Qdrant will respond much slower to searches and writes.
The reason for this is usually a high write load which overloads the cluster when creating or updating indexes. A very high search load with inefficient or complex queries can contribute.
What can I do to resolve this?
You can reduce the amount of writes to your database. e.g. by performing the writes in batches during times when you have less search traffic, or performing less writes in parallel.
Indexing data properly will optimize query results and improve search performance reducing potential load.
While hybrid and multi-stage queries are CPU intensive techniques, they can be used to optimize and reduce the quantity of inefficient operations. On the other hand if you are using these techniques too much, you may consider simplifying some operations to be less intensive.
You can re-configure Qdrant Optimizers to reduce the load on the cluster.
It is also possible to scale your cluster horizontally or vertically for higher CPU capacity.
Where can I learn more about this alert?
Learn how to optimize Qdrant for performance and configure indexing here and here.
Learn about optimizers here.
Learn more about hybrid search here.
Node CPU Usage is Not Distributed Equally
Why am I getting this alert?
CPU usage is not consistent across nodes in your cluster.
What does this mean for me?
Hotspotting, where a subset of nodes handle more load than the rest, causes slow search performance and potentially node failures.*
For uneven CPU usage it typically means data distribution across nodes is uneven.
What can I do to resolve this?
Resharding and shard rebalancing are the primary techniques for ensuring data is evenly distributed and that requests are not concentrated on a single node.
Where can I learn more about this alert?
Learn more about cloud rebalancing here.
Node RAM or Disk Space Usage is Not Distributed Equally
Why am I getting this alert?
RAM/Storage usage is not consistent across nodes in your cluster.
What does this mean for me?
Hotspotting, where a subset of nodes handle more load than the rest, causes slow search performance and potentially node failures.*
For RAM/Storage usage it typically means data distribution across nodes is uneven.
What can I do to resolve this?
Resharding and rebalancing shards are both tactics to redistribute the load across your cluster evenly.
Resharding allows you to scale the number of shards in a collection up or down without recreating the collection.
This would help when your node count has been scaled up so you can reshard a collection to split it more evenly with a rebalance.
Rebalancing is the process of redistributing shards across nodes which is useful if you add a new node and need to fill the capacity. In Qdrant Cloud, rebalancing happens automatically when a cluster is scaled horizontally.
Where can I learn more about this alert?
Learn more about distributed deployments and resharding here.
Learn more about cloud rebalancing here.
Qdrant Database Metrics and Telemetry
You can also directly access the metrics and telemetry that the Qdrant database nodes provide.
To scrape metrics from a Qdrant cluster running in Qdrant Cloud, an API key is required to access /metrics and /sys_metrics. Qdrant Cloud also supports supplying the API key as a Bearer token, which may be required by some providers.
Qdrant Node Metrics
Metrics in a Prometheus-compatible format are available at the /metrics endpoint of each Qdrant database node. When scraping, you should use the node specific URLs to ensure that you are scraping metrics from all nodes in each cluster. For more information, see Qdrant monitoring.
You can also access the /telemetry endpoint of your database. This endpoint is available on the cluster endpoint and provides information about the current state of the database, including the number of vectors, shards, and other useful information.
For more information, see Qdrant monitoring.
Cluster System Metrics
Cluster system metrics is a cloud-only endpoint that not only shares all the information about the database from /metrics but also provides additional operational data from our infrastructure about your cluster, including information from our load balancers, ingresses, and cluster workloads themselves.
Metrics in a Prometheus-compatible format are available at the /sys_metrics cluster endpoint. Database API Keys are used to authenticate access to cluster system metrics. /sys_metrics only needs to be queried once per cluster on the main load-balanced cluster endpoint. You don’t need to scrape each cluster node individually, instead it will always provide metrics about all nodes.
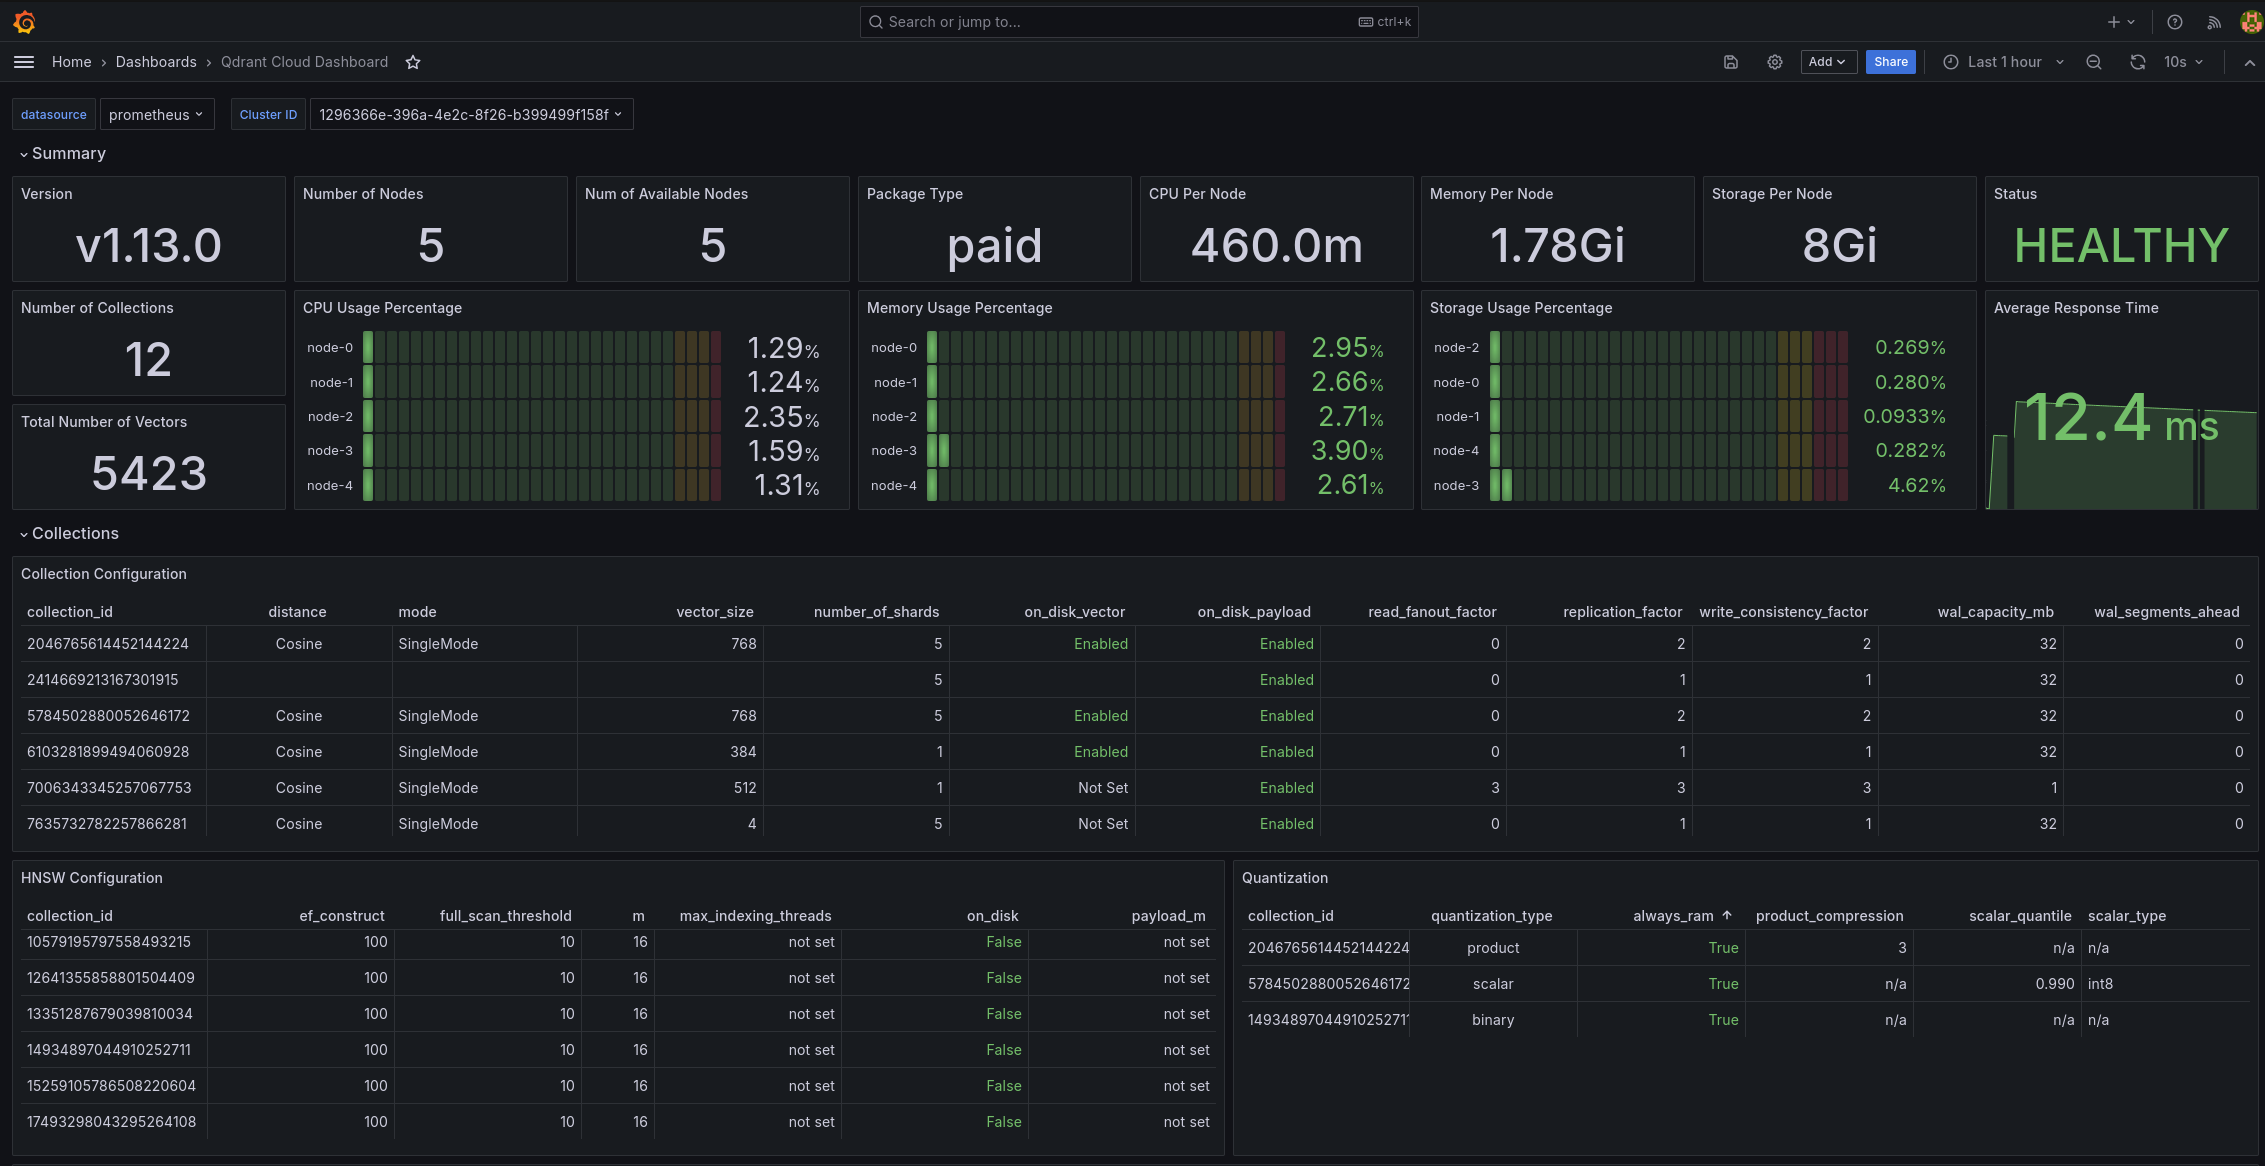
Grafana Dashboard
If you scrape your Qdrant cluster system metrics into your own monitoring system, and you are using Grafana, you can use our Grafana dashboard to visualize these metrics.
Cluster System Metrics /sys_metrics
In Qdrant Cloud, each Qdrant cluster will expose the following metrics. This endpoint is not available when running Qdrant open-source.
List of metrics
| Name | Type | Meaning |
|---|---|---|
| app_info | gauge | Information about the Qdrant server |
| app_status_recovery_mode | gauge | If Qdrant is currently started in recovery mode |
| cluster_commit | ||
| cluster_enabled | Indicates whether multi-node clustering is enabled | |
| cluster_peers_total | counter | Total number of cluster peers |
| cluster_pending_operations_total | counter | Total number of pending operations in the cluster |
| cluster_term | ||
| cluster_voter | ||
| collection_hardware_metric_cpu | ||
| collection_hardware_metric_io_read | ||
| collection_hardware_metric_io_write | ||
| collections_total | counter | Number of collections |
| collections_vector_total | counter | Total number of vectors in all collections |
| container_cpu_cfs_periods_total | ||
| container_cpu_cfs_throttled_periods_total | counter | Indicating that your CPU demand was higher than what your instance offers |
| container_cpu_usage_seconds_total | counter | Total CPU usage in seconds |
| container_file_descriptors | ||
| container_fs_reads_bytes_total | counter | Total number of bytes read by the container file system (disk) |
| container_fs_reads_total | counter | Total number of read operations on the container file system (disk) |
| container_fs_writes_bytes_total | counter | Total number of bytes written by the container file system (disk) |
| container_fs_writes_total | counter | Total number of write operations on the container file system (disk) |
| container_memory_cache | gauge | Memory used for cache in the container |
| container_memory_mapped_file | gauge | Memory used for memory-mapped files in the container |
| container_memory_rss | gauge | Resident Set Size (RSS) - Memory used by the container excluding swap space used for caching |
| container_memory_working_set_bytes | gauge | Total memory used by the container, including both anonymous and file-backed memory |
| container_network_receive_bytes_total | counter | Total bytes received over the container’s network interface |
| container_network_receive_errors_total | ||
| container_network_receive_packets_dropped_total | ||
| container_network_receive_packets_total | ||
| container_network_transmit_bytes_total | counter | Total bytes transmitted over the container’s network interface |
| container_network_transmit_errors_total | ||
| container_network_transmit_packets_dropped_total | ||
| container_network_transmit_packets_total | ||
| kube_persistentvolumeclaim_info | ||
| kube_pod_container_info | ||
| kube_pod_container_resource_limits | gauge | Response contains limits for CPU and memory of DB. |
| kube_pod_container_resource_requests | gauge | Response contains requests for CPU and memory of DB. |
| kube_pod_container_status_last_terminated_exitcode | ||
| kube_pod_container_status_last_terminated_reason | ||
| kube_pod_container_status_last_terminated_timestamp | ||
| kube_pod_container_status_ready | ||
| kube_pod_container_status_restarts_total | ||
| kube_pod_container_status_running | ||
| kube_pod_container_status_terminated | ||
| kube_pod_container_status_terminated_reason | ||
| kube_pod_created | ||
| kube_pod_info | ||
| kube_pod_start_time | ||
| kube_pod_status_container_ready_time | ||
| kube_pod_status_initialized_time | ||
| kube_pod_status_phase | gauge | Pod status in terms of different phases (Failed/Running/Succeeded/Unknown) |
| kube_pod_status_ready | gauge | Pod readiness state (unknown/false/true) |
| kube_pod_status_ready_time | ||
| kube_pod_status_reason | ||
| kubelet_volume_stats_capacity_bytes | gauge | Amount of disk available |
| kubelet_volume_stats_inodes | gauge | Amount of inodes available |
| kubelet_volume_stats_inodes_used | gauge | Amount of inodes used |
| kubelet_volume_stats_used_bytes | gauge | Amount of disk used |
| memory_active_bytes | ||
| memory_allocated_bytes | ||
| memory_metadata_bytes | ||
| memory_resident_bytes | ||
| memory_retained_bytes | ||
| qdrant_cluster_state | ||
| qdrant_collection_commit | ||
| qdrant_collection_config_hnsw_full_ef_construct | ||
| qdrant_collection_config_hnsw_full_scan_threshold | ||
| qdrant_collection_config_hnsw_m | ||
| qdrant_collection_config_hnsw_max_indexing_threads | ||
| qdrant_collection_config_hnsw_on_disk | ||
| qdrant_collection_config_hnsw_payload_m | ||
| qdrant_collection_config_optimizer_default_segment_number | ||
| qdrant_collection_config_optimizer_deleted_threshold | ||
| qdrant_collection_config_optimizer_flush_interval_sec | ||
| qdrant_collection_config_optimizer_indexing_threshold | ||
| qdrant_collection_config_optimizer_max_optimization_threads | ||
| qdrant_collection_config_optimizer_max_segment_size | ||
| qdrant_collection_config_optimizer_memmap_threshold | ||
| qdrant_collection_config_optimizer_vacuum_min_vector_number | ||
| qdrant_collection_config_params_always_ram | ||
| qdrant_collection_config_params_on_disk_payload | ||
| qdrant_collection_config_params_product_compression | ||
| qdrant_collection_config_params_read_fanout_factor | ||
| qdrant_collection_config_params_replication_factor | ||
| qdrant_collection_config_params_scalar_quantile | ||
| qdrant_collection_config_params_scalar_type | ||
| qdrant_collection_config_params_shard_number | ||
| qdrant_collection_config_params_vector_size | ||
| qdrant_collection_config_params_write_consistency_factor | ||
| qdrant_collection_config_quantization_always_ram | ||
| qdrant_collection_config_quantization_product_compression | ||
| qdrant_collection_config_quantization_scalar_quantile | ||
| qdrant_collection_config_quantization_scalar_type | ||
| qdrant_collection_config_wal_capacity_mb | ||
| qdrant_collection_config_wal_segments_ahead | ||
| qdrant_collection_consensus_thread_status | ||
| qdrant_collection_is_voter | ||
| qdrant_collection_number_of_collections | counter | Total number of collections in Qdrant |
| qdrant_collection_number_of_grpc_requests | counter | Total number of gRPC requests on a collection |
| qdrant_collection_number_of_rest_requests | counter | Total number of REST requests on a collection |
| qdrant_collection_pending_operations | counter | Total number of pending operations on a collection |
| qdrant_collection_role | ||
| qdrant_collection_shard_segment_num_indexed_vectors | ||
| qdrant_collection_shard_segment_num_points | ||
| qdrant_collection_shard_segment_num_vectors | ||
| qdrant_collection_shard_segment_type | ||
| qdrant_collection_term | ||
| qdrant_collection_transfer | ||
| qdrant_operator_cluster_info_total | ||
| qdrant_operator_cluster_phase | gauge | Information about the status of Qdrant clusters |
| qdrant_operator_cluster_pod_up_to_date | ||
| qdrant_operator_cluster_restore_info_total | ||
| qdrant_operator_cluster_restore_phase | ||
| qdrant_operator_cluster_scheduled_snapshot_info_total | ||
| qdrant_operator_cluster_scheduled_snapshot_phase | ||
| qdrant_operator_cluster_snapshot_duration_sconds | ||
| qdrant_operator_cluster_snapshot_phase | gauge | Information about the status of Qdrant cluster backups |
| qdrant_operator_cluster_status_nodes | ||
| qdrant_operator_cluster_status_nodes_ready | ||
| qdrant_node_rssanon_bytes | gauge | Allocated memory without memory-mapped files. This is the hard metric on memory which will lead to an OOM if it goes over the limit |
| rest_responses_avg_duration_seconds | ||
| rest_responses_duration_seconds_bucket | ||
| rest_responses_duration_seconds_count | ||
| rest_responses_duration_seconds_sum | ||
| rest_responses_fail_total | ||
| rest_responses_max_duration_seconds | ||
| rest_responses_min_duration_seconds | ||
| rest_responses_total | ||
| traefik_service_open_connections | ||
| traefik_service_request_duration_seconds_bucket | ||
| traefik_service_request_duration_seconds_count | ||
| traefik_service_request_duration_seconds_sum | gauge | Response contains list of metrics for each Traefik service. |
| traefik_service_requests_bytes_total | ||
| traefik_service_requests_total | counter | Response contains list of metrics for each Traefik service. |
| traefik_service_responses_bytes_total |